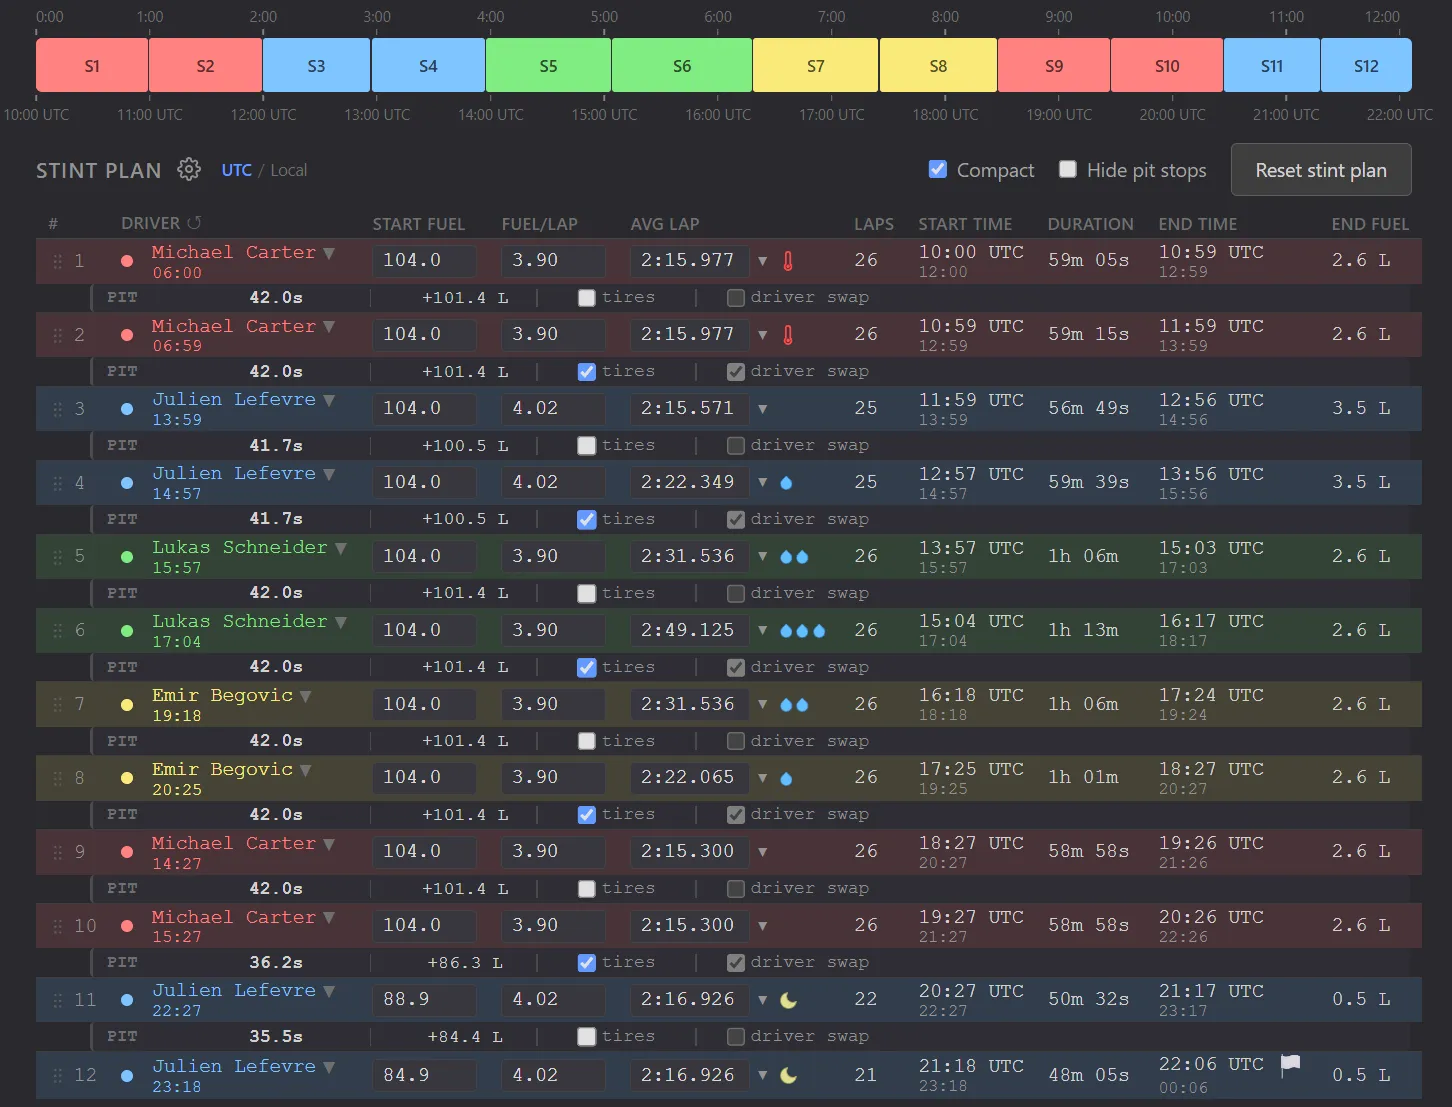
Race planner: a 12-hour race split into 12 stints across four drivers, with fuel, lap times, pit stops and start and end times for each stint

Strategy platform for endurance sim racing

We make endurance racing easy and give you competitive advantages. Our tools also work in any race on iRacing, not only endurance.

  • Plan pit stops, stints, and driver rotations for endurance races
  • See how the race unfolds vs the initial plan, and update your strategy live
  • Monitor your competitors' strategies and make the right calls
  • Reach your team's fuel and lap targets with our live fuel overlay
  • Analyze your full race telemetry across every driver's stint, synced with your replay
  • Dig into your team's performance on pit entries and pit exits to find even more time

It's free!

Try our features now

Try most of our features with actual race data without creating an account.

Race planner

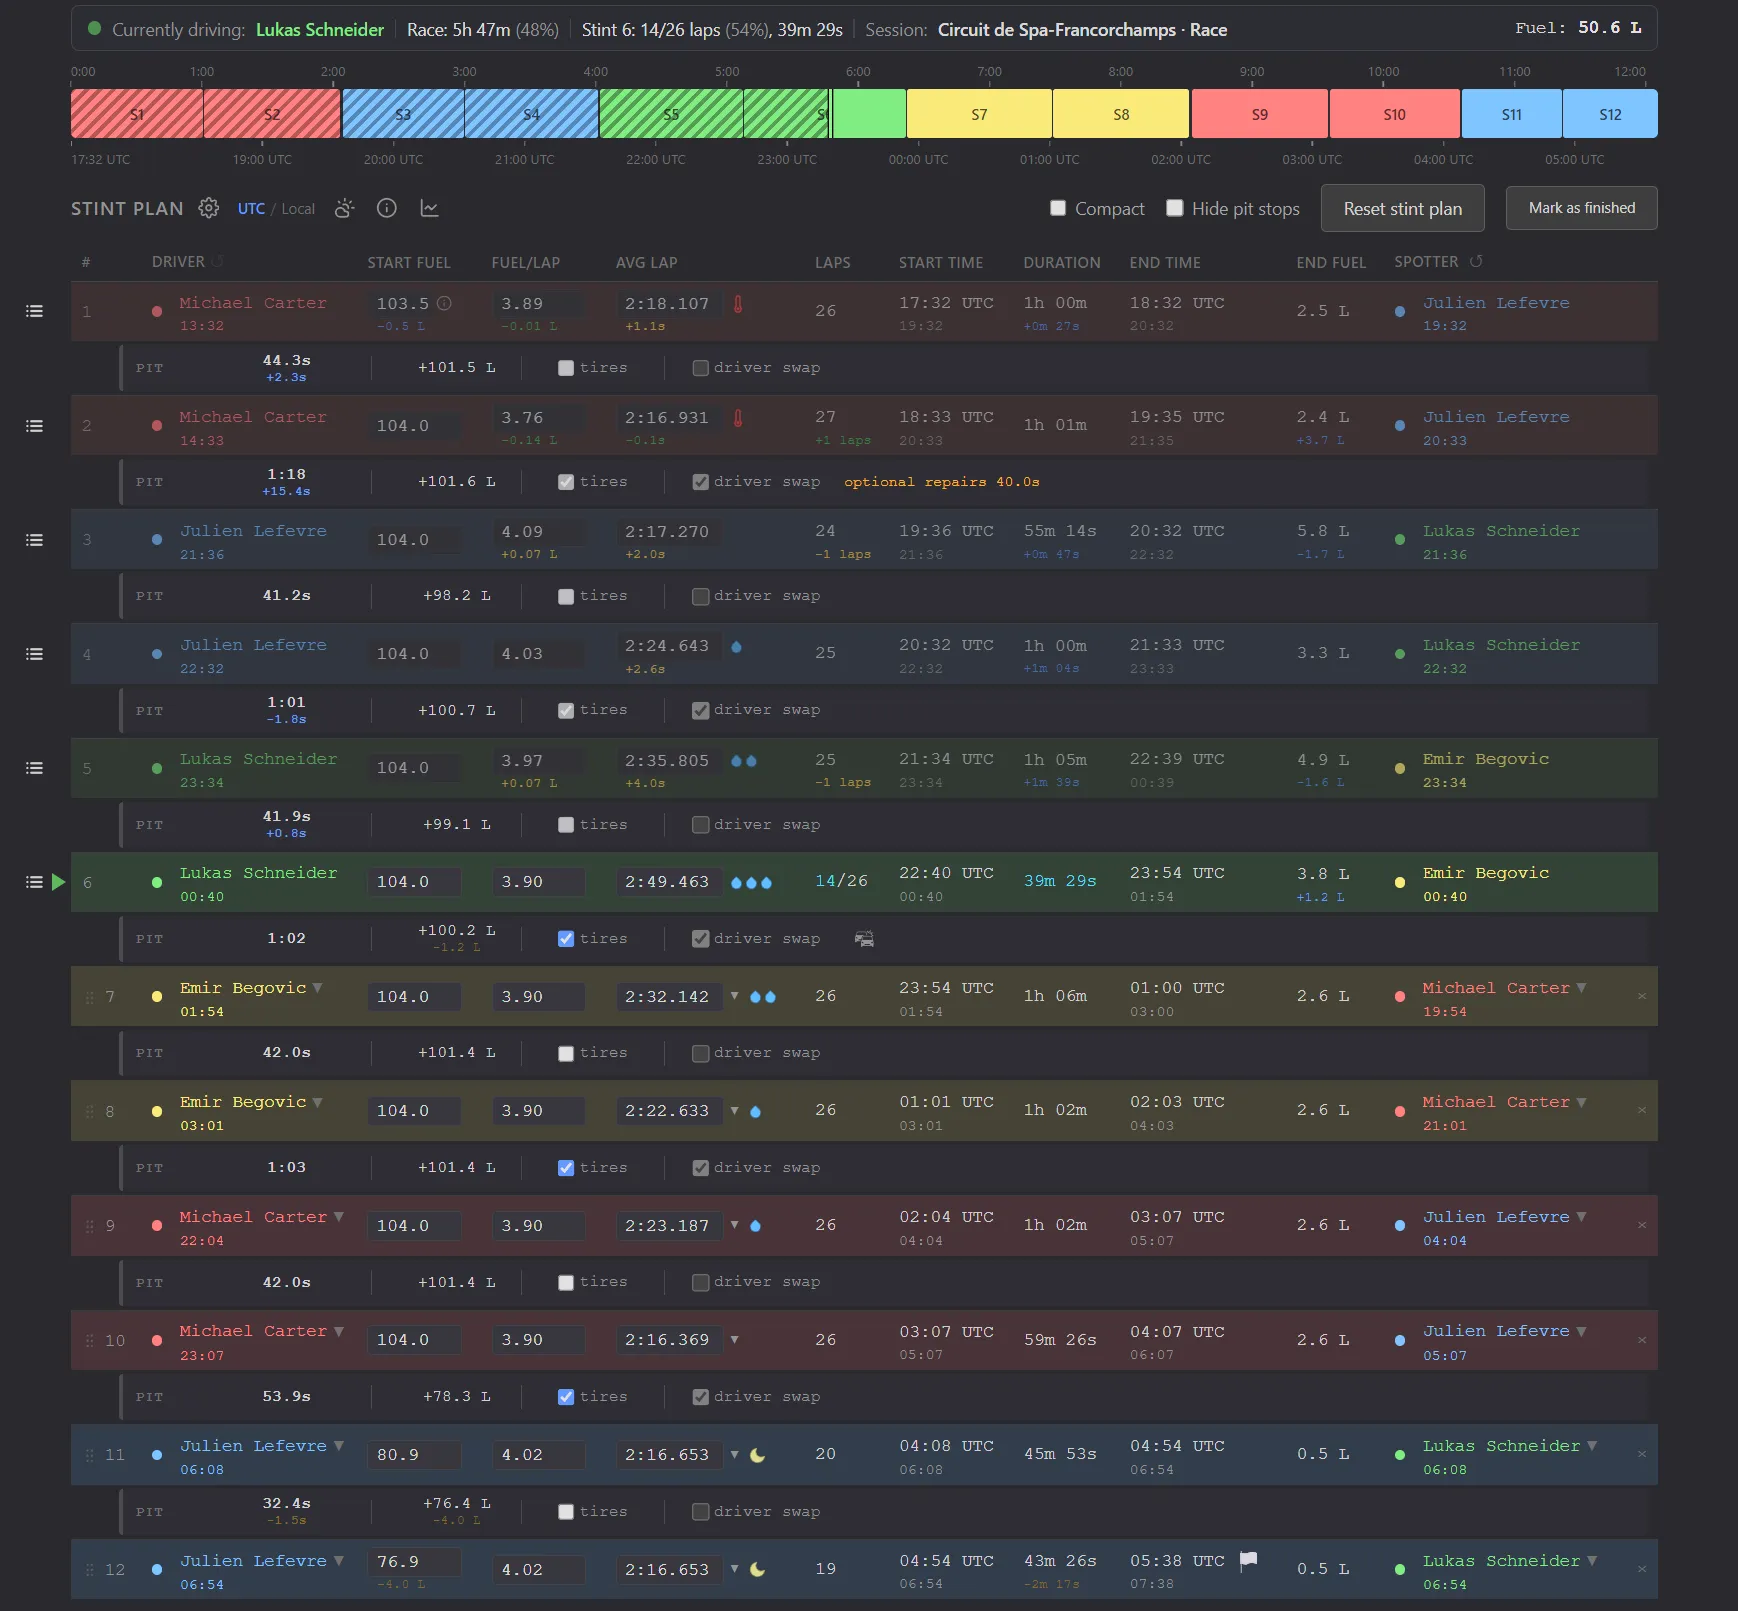
Plan your race with your team

  • Casual teams
    • Generate your race plan in seconds.
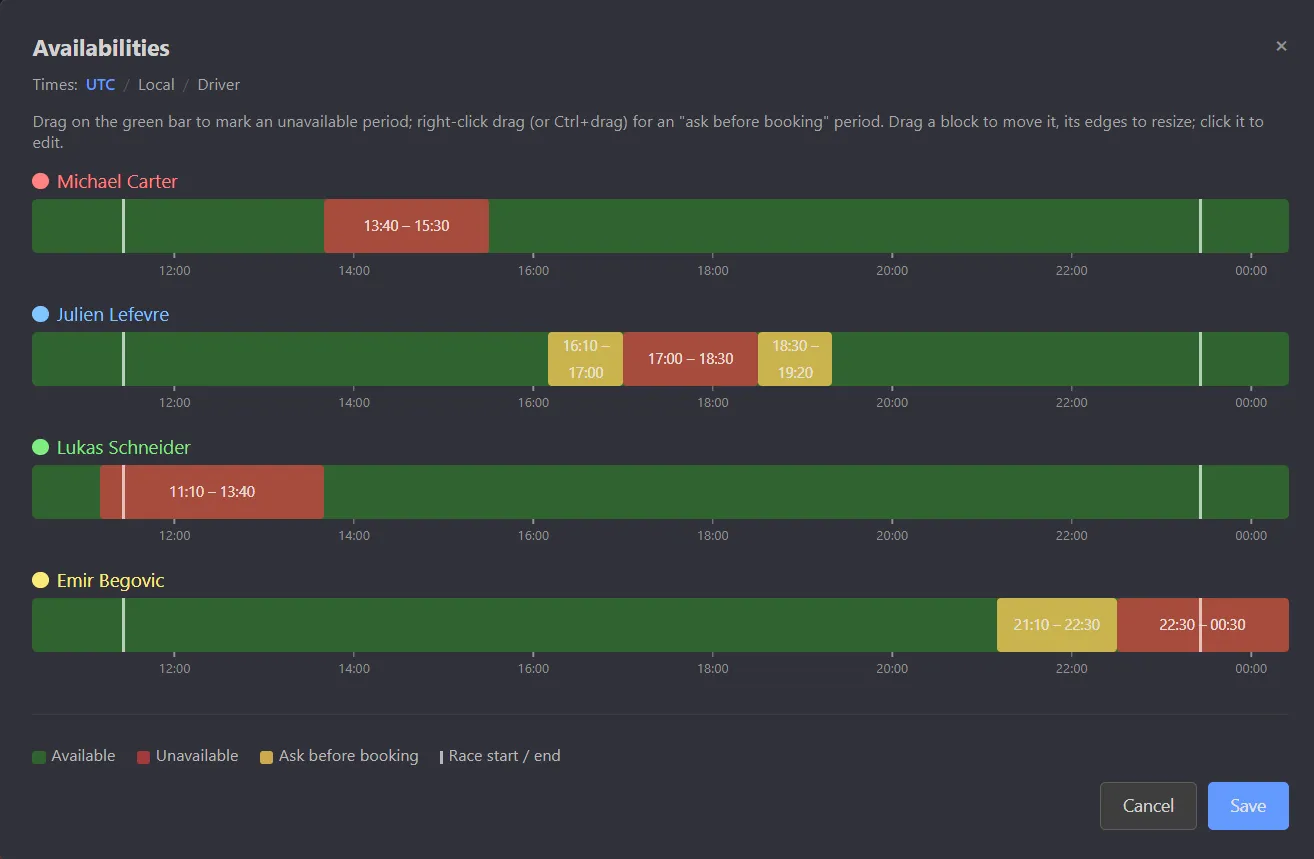
    • Entering drivers' availability has never been easier.
    • Work on your race plan collaboratively: changes are visible live to all team members.
    • Our database of default parameters lets you focus less on the plan and more on your race.
  • Advanced teams
    • Go deeper: account for differences between drivers and expected track conditions.
    • Some of your drivers are faster, or can save a bit more fuel and do one more lap? Plan for it in your strategy.
    • Rain is expected, or night time might change the pace? Build your strategy accordingly.
  • Expert teams
    • Optimize to the tenth: use our Pit Stop Analyzer to measure the actual cost of pitting for this car x track combo.
    • Use the standard or NEC refuel rate or your own measurement, account for cold tires and the fuel used during the formation lap.
    • Time your pit stops perfectly by measuring the delays due to your crew between all the pit stop services.
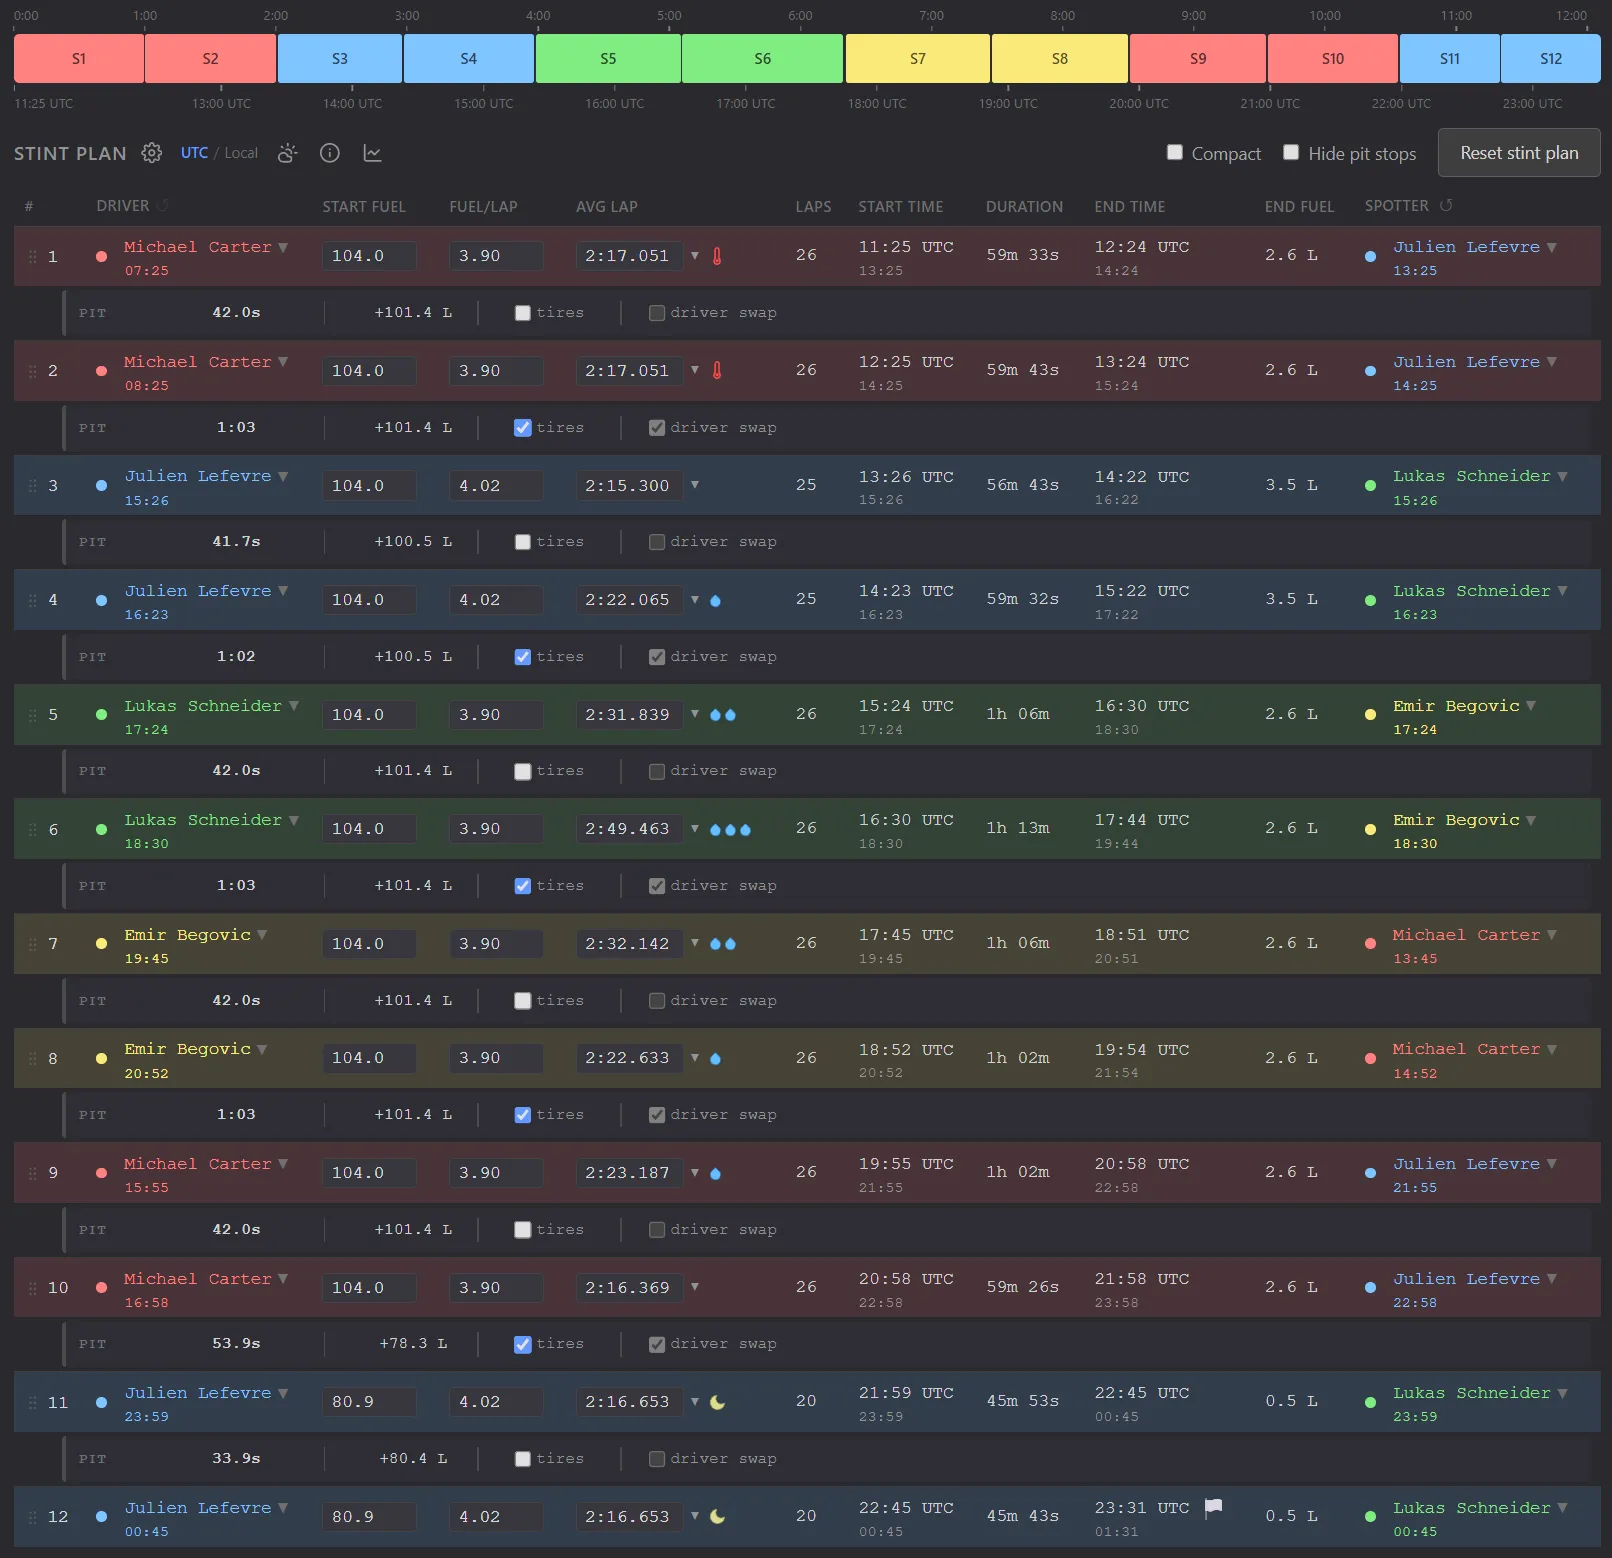
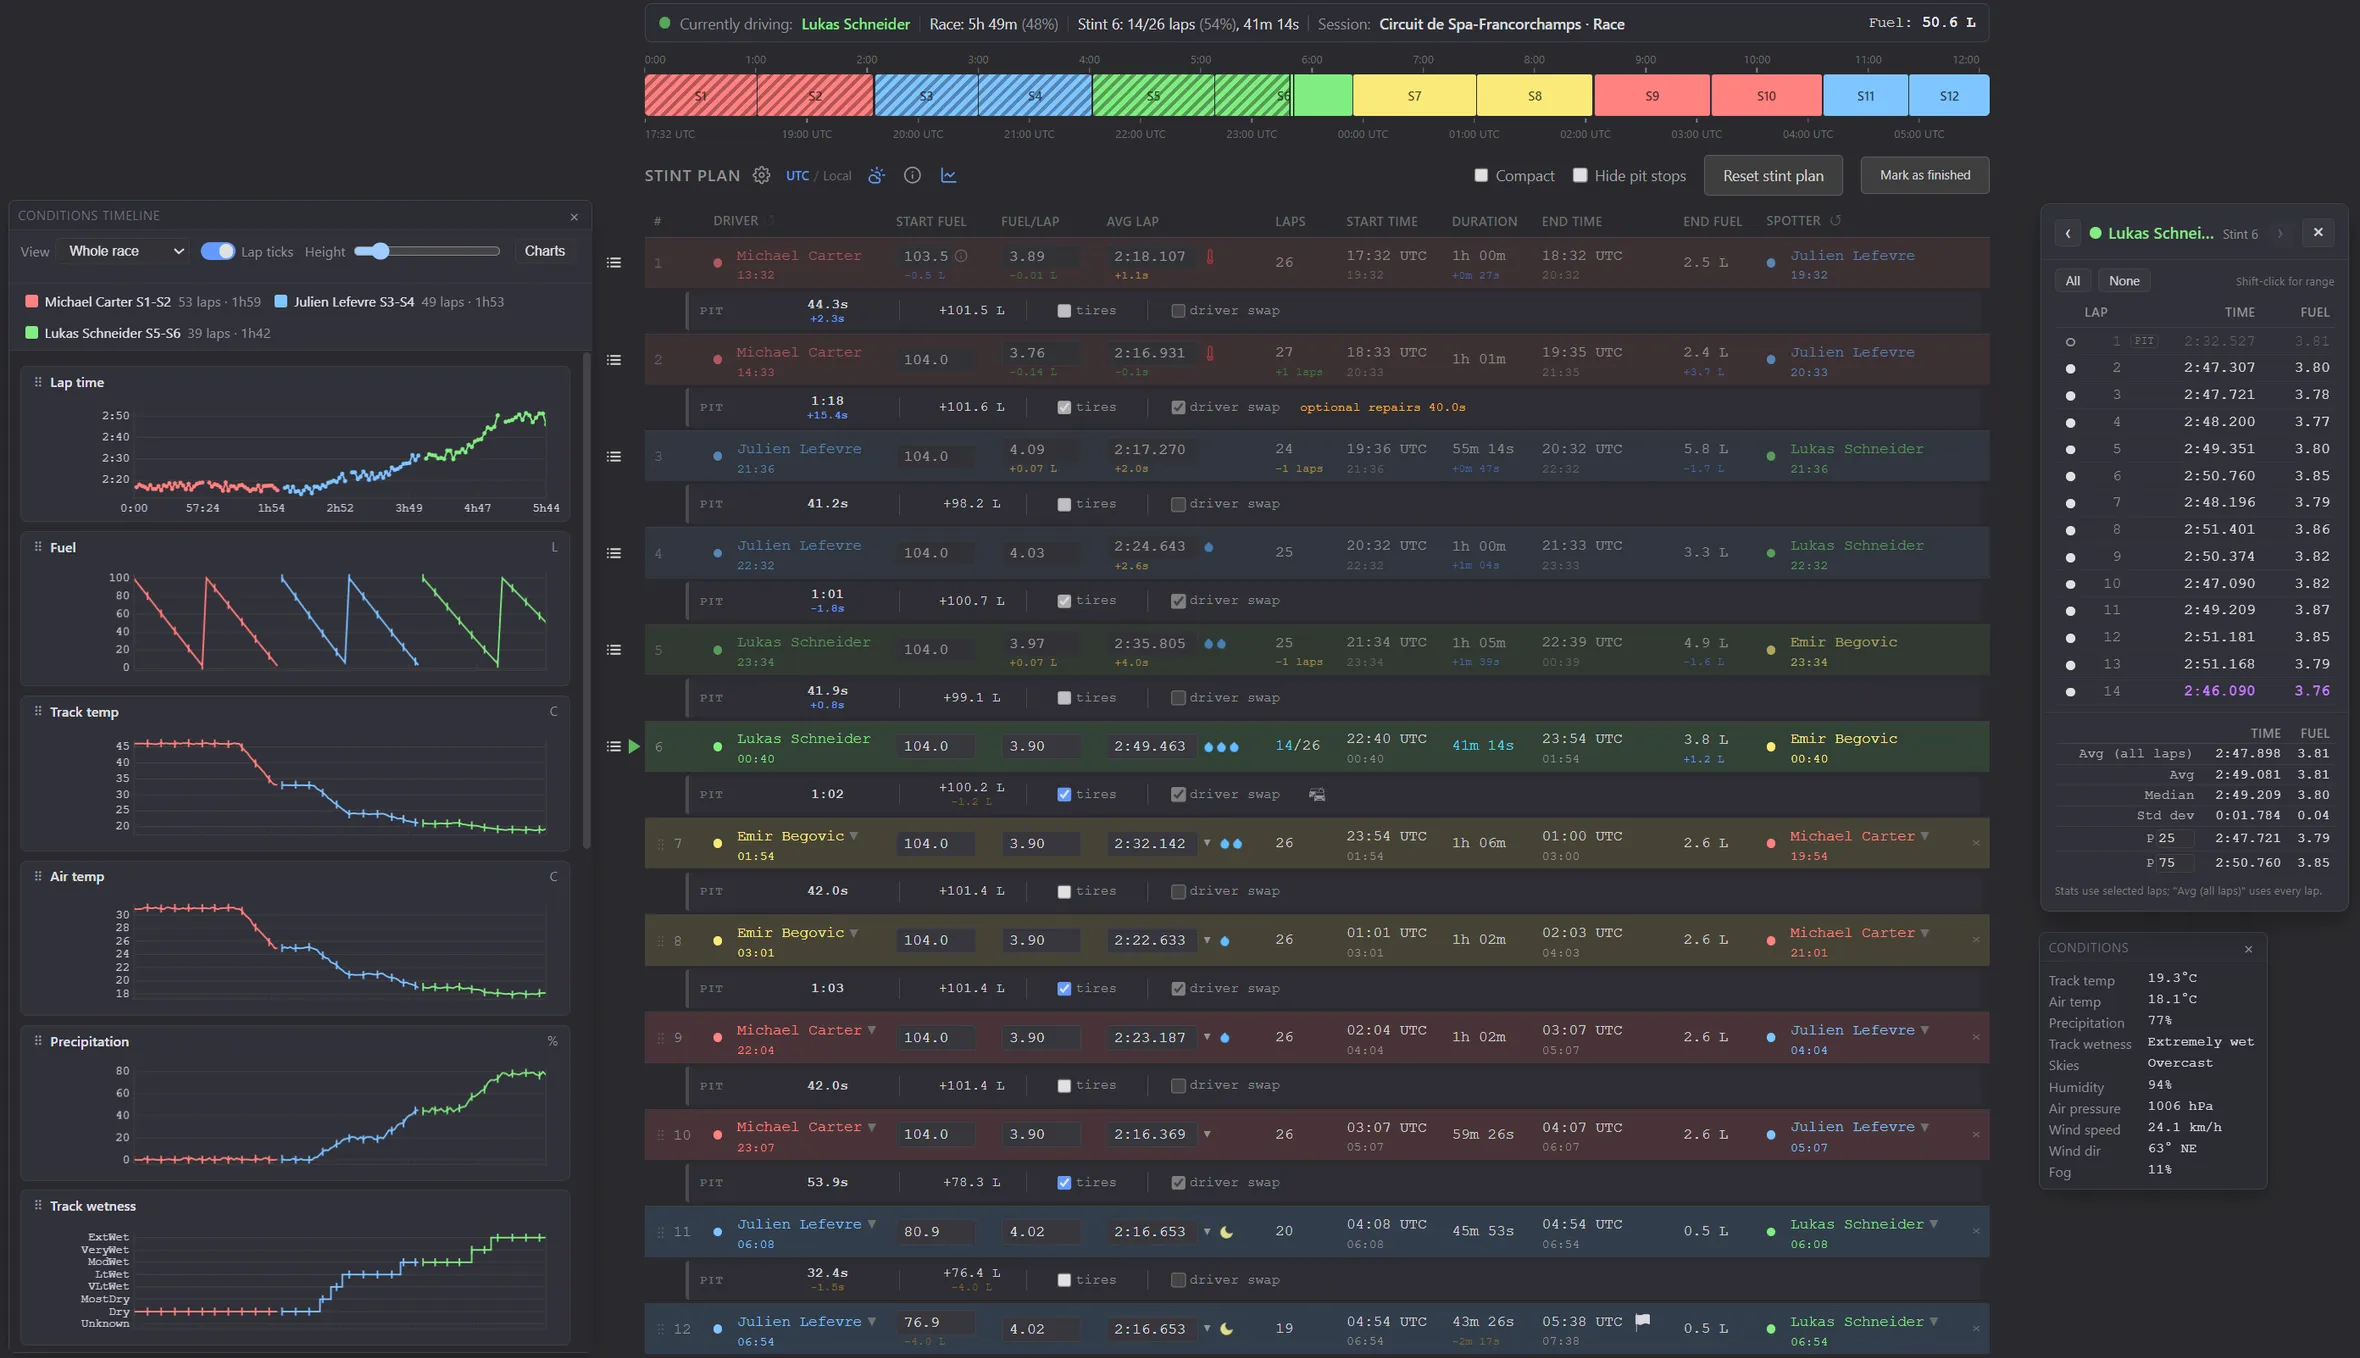
Race planner with the stint plan and the timeline The Availabilities window: each driver's unavailable and ask-before-booking periods over the race

Live race plan

See your plan update live during the race, and update your strategy whenever needed

  • A change of plan? A driver didn't wake up for their 3am stint? You can still change everything live. We know your focus is on the race, so changes only require one click or a quick drag and drop.
  • View live track conditions and identify trends. Tell your driver "track temperature was 22-24 degrees on your first stint, but now it's 35 degrees and rising".
  • Smart deltas let you see what you planned vs what actually happened. Your lap times estimate was too optimistic? Update it to match reality.
  • Your race plan has changed compared to the initial plan? Our smart deltas make any change visible on future stints. If a driver did one lap less than expected, the last stint will show one more lap compared to the original plan.
  • View the race plan using UTC time, your own local time, the local time of the driver, the local time of the spotter - all at once! Tell your next driver "Your next stint is scheduled to start at 10:32" even if it's 16:32 for you. Focus on your race, not on converting times.
  • "You have damage". We all fear this, but your race is not over. Estimate your damage and see how your plan changes. Once actual damage is known, your plan is updated automatically to account for required repairs.
The live stint plan: five stints completed, the sixth in progress, planned against actual The conditions timeline and the lap times of the same race, next to the stint plan

Driver fuel overlay

Our fuel overlay actually makes you a better endurance driver and gives you a competitive advantage

  • Our fuel overlay doesn't just update once per lap - it's fully live.
  • Learn how to efficiently save fuel: lift and coast at the end of a straight, and see exactly how much fuel you saved while coasting. No more guessing!
  • Your team asked you to decrease your fuel usage from 3.95 to 3.85 L/lap? Nothing easier, lift and coast and see your fuel usage update live. Gone the frustration to wait for the lap to finish to realize you saved too much or too little.
  • Get actual competitive advantages:
    • Fuel to spare? This overlay shows you that you can push so you get to the finish line with only 0.3 L of fuel left. Turn every drop of fuel from dead weight into performance!
    • Need to extend your stint by one more lap? This overlay tells you exactly what fuel usage you need to extend your stint by one more lap, and does so live. This can avoid you an extra pit stop at the end of the race!
  • Stop thinking in liters and learn to think in terms of pace. You don't need 21 liters of fuel with 0.5 laps margin, you need 6 laps with 3.45 L/lap push pace.
  • Once you try it you'll never want to drive without.
Minimalist: live fuel usage only
2.85 L/lap
Basic fuel strategy: adds laps left and fuel target
2.85 L/lap | 7 | [2.70-2.94]
Stint and team collaboration: adds time left and total stint duration
2.85 L/lap | 7 | [2.70-2.94] | 13:40 | 42:30

Race view

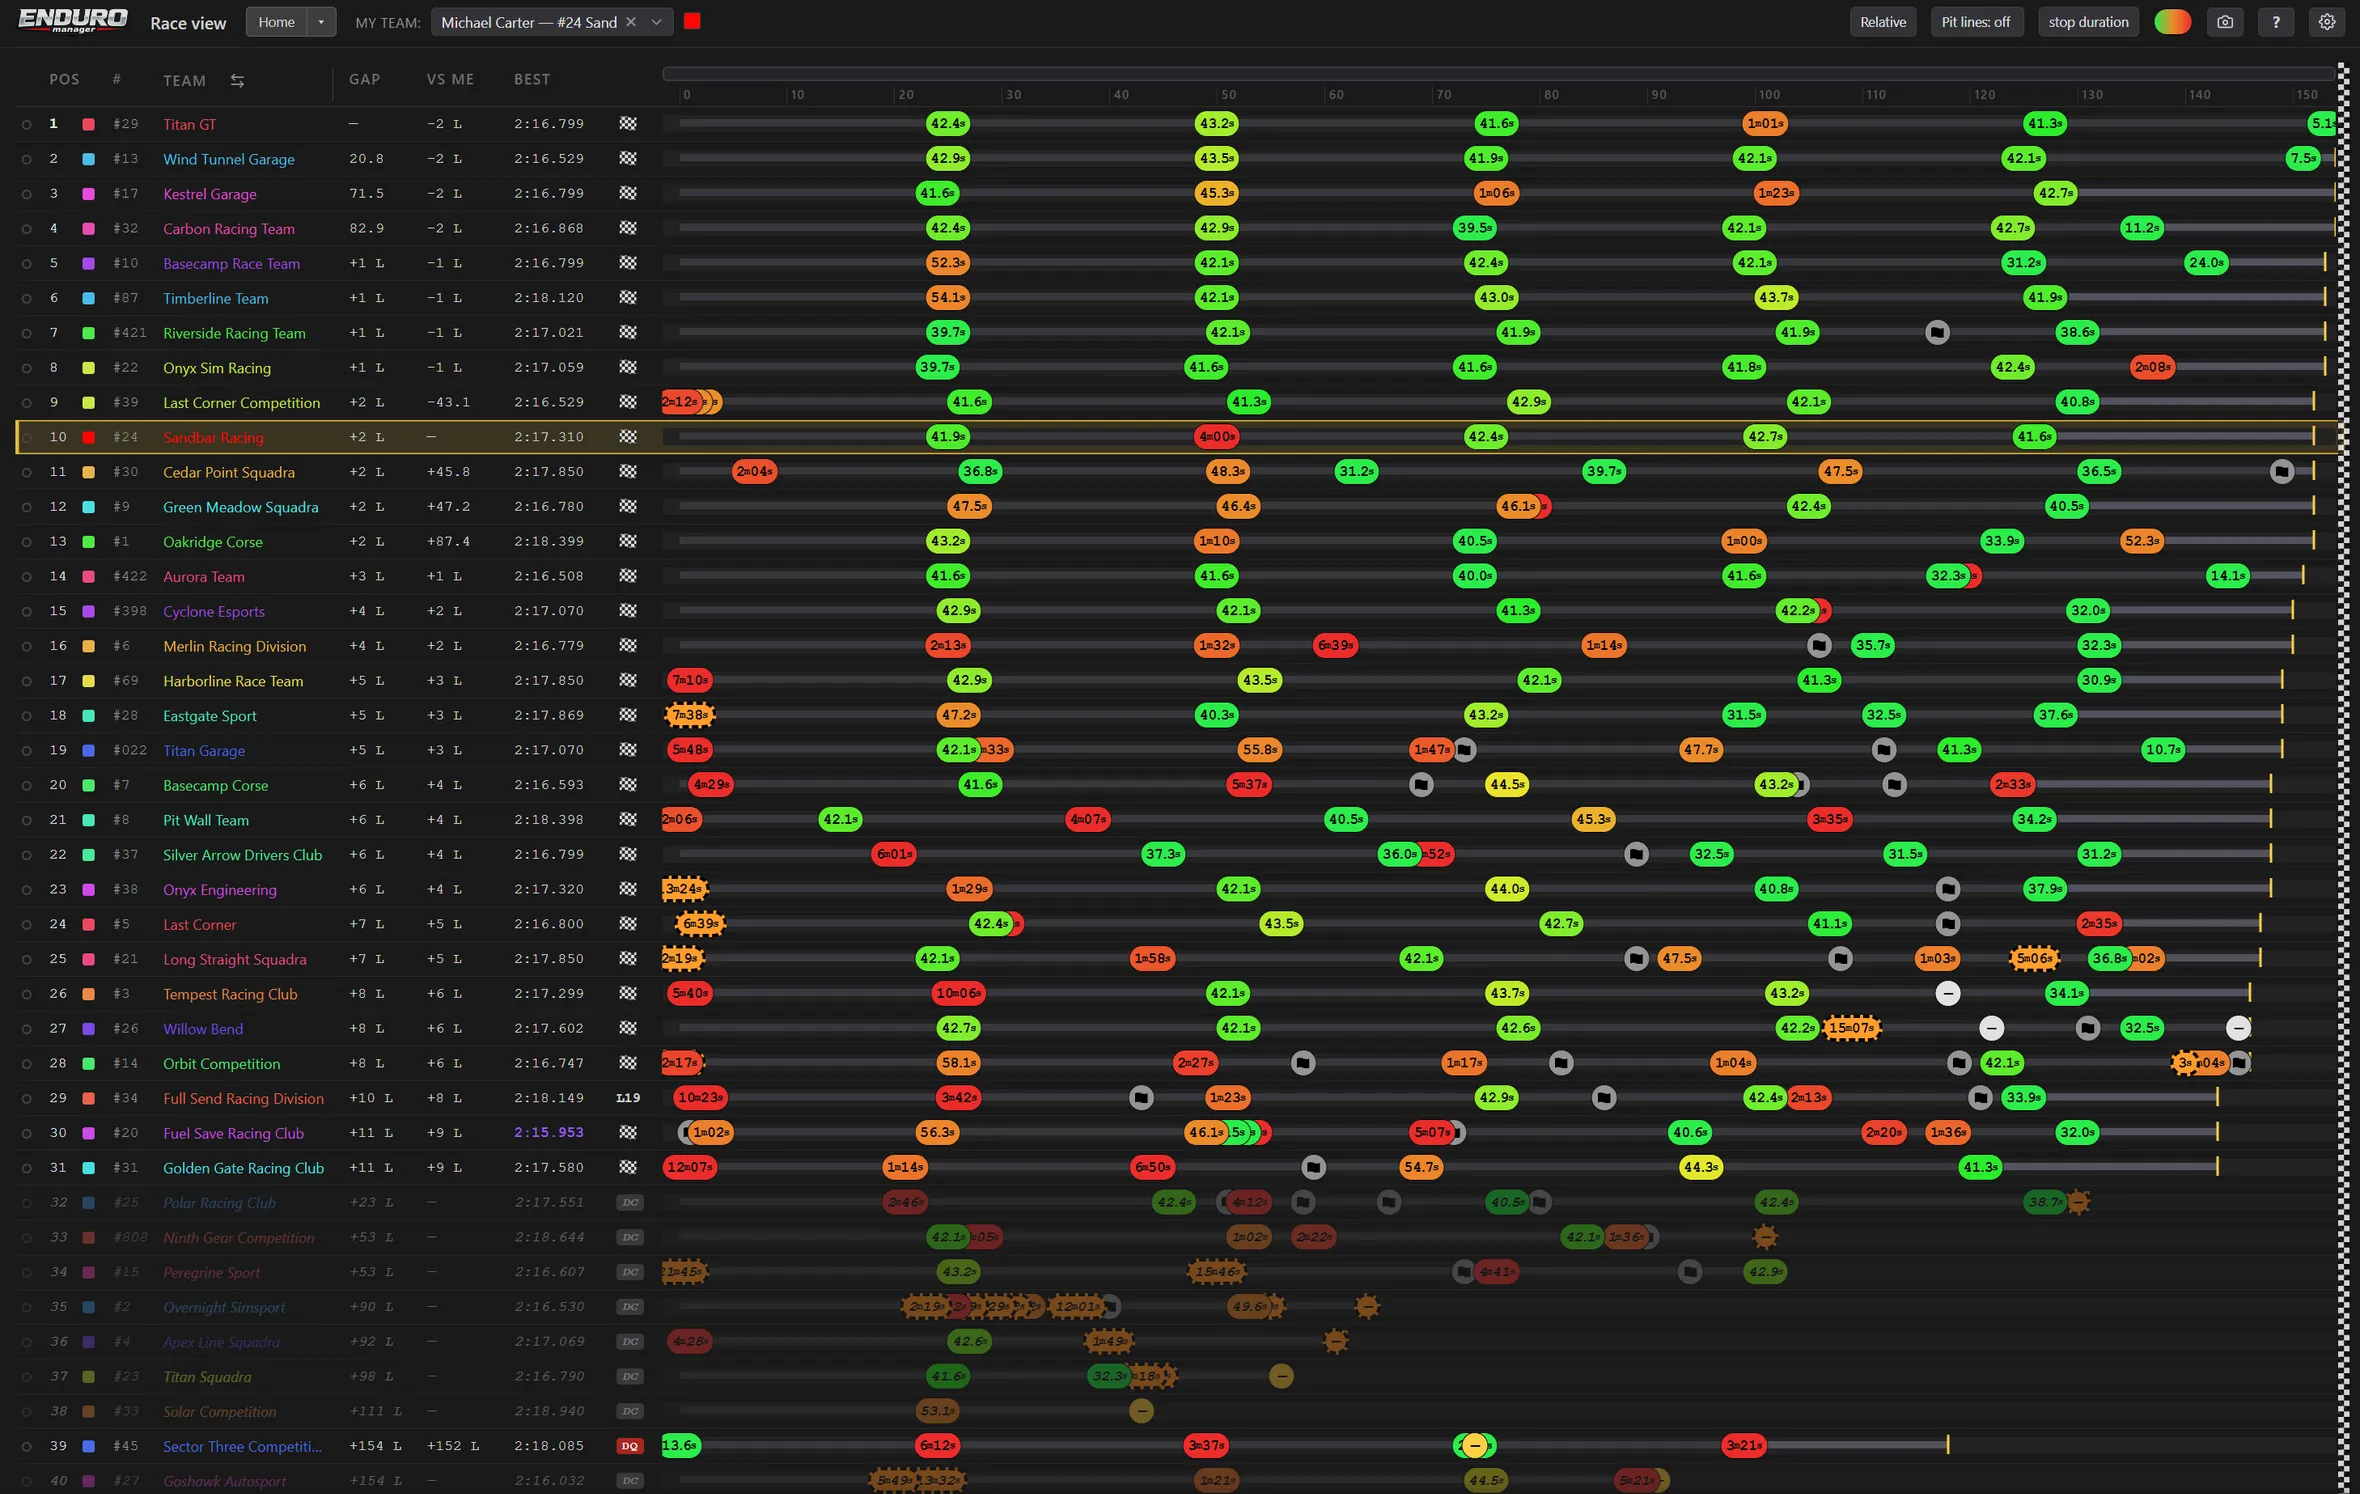
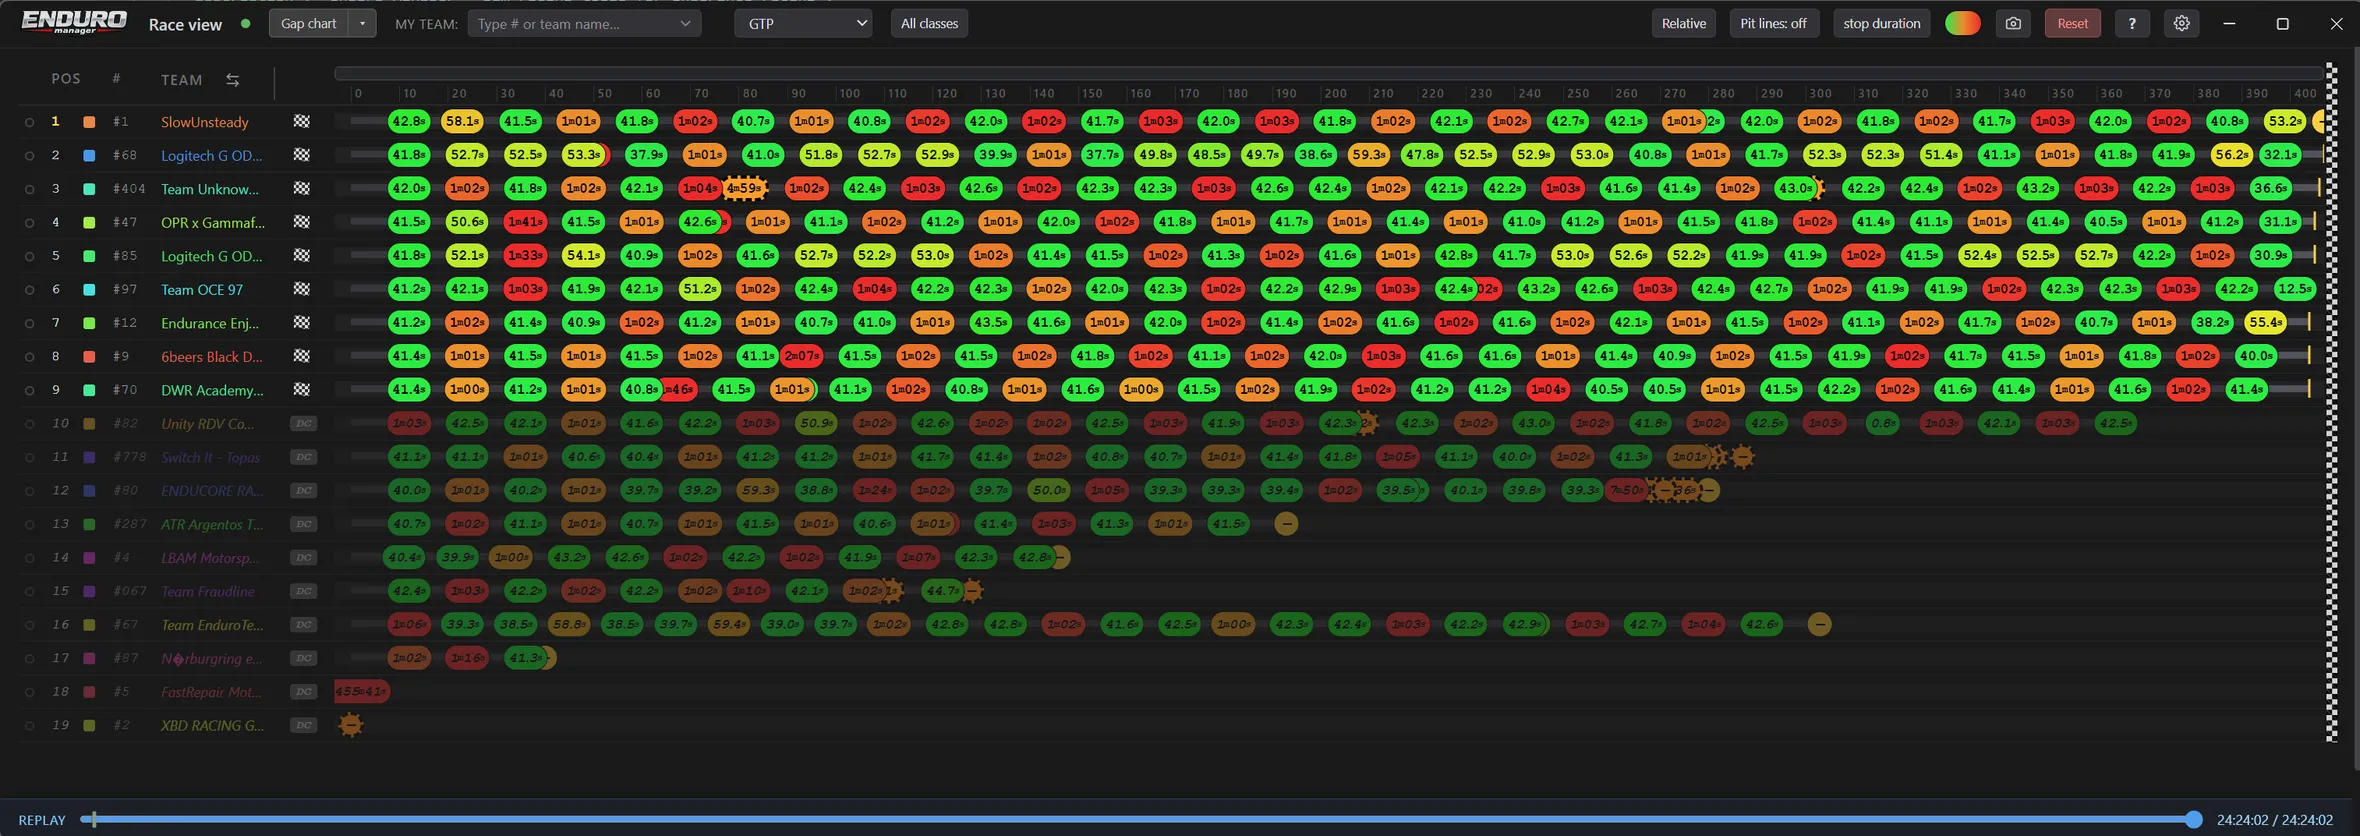
See the whole race and watch every competitor's pit strategy

  • Fight other teams not just on track, but also in the pits.
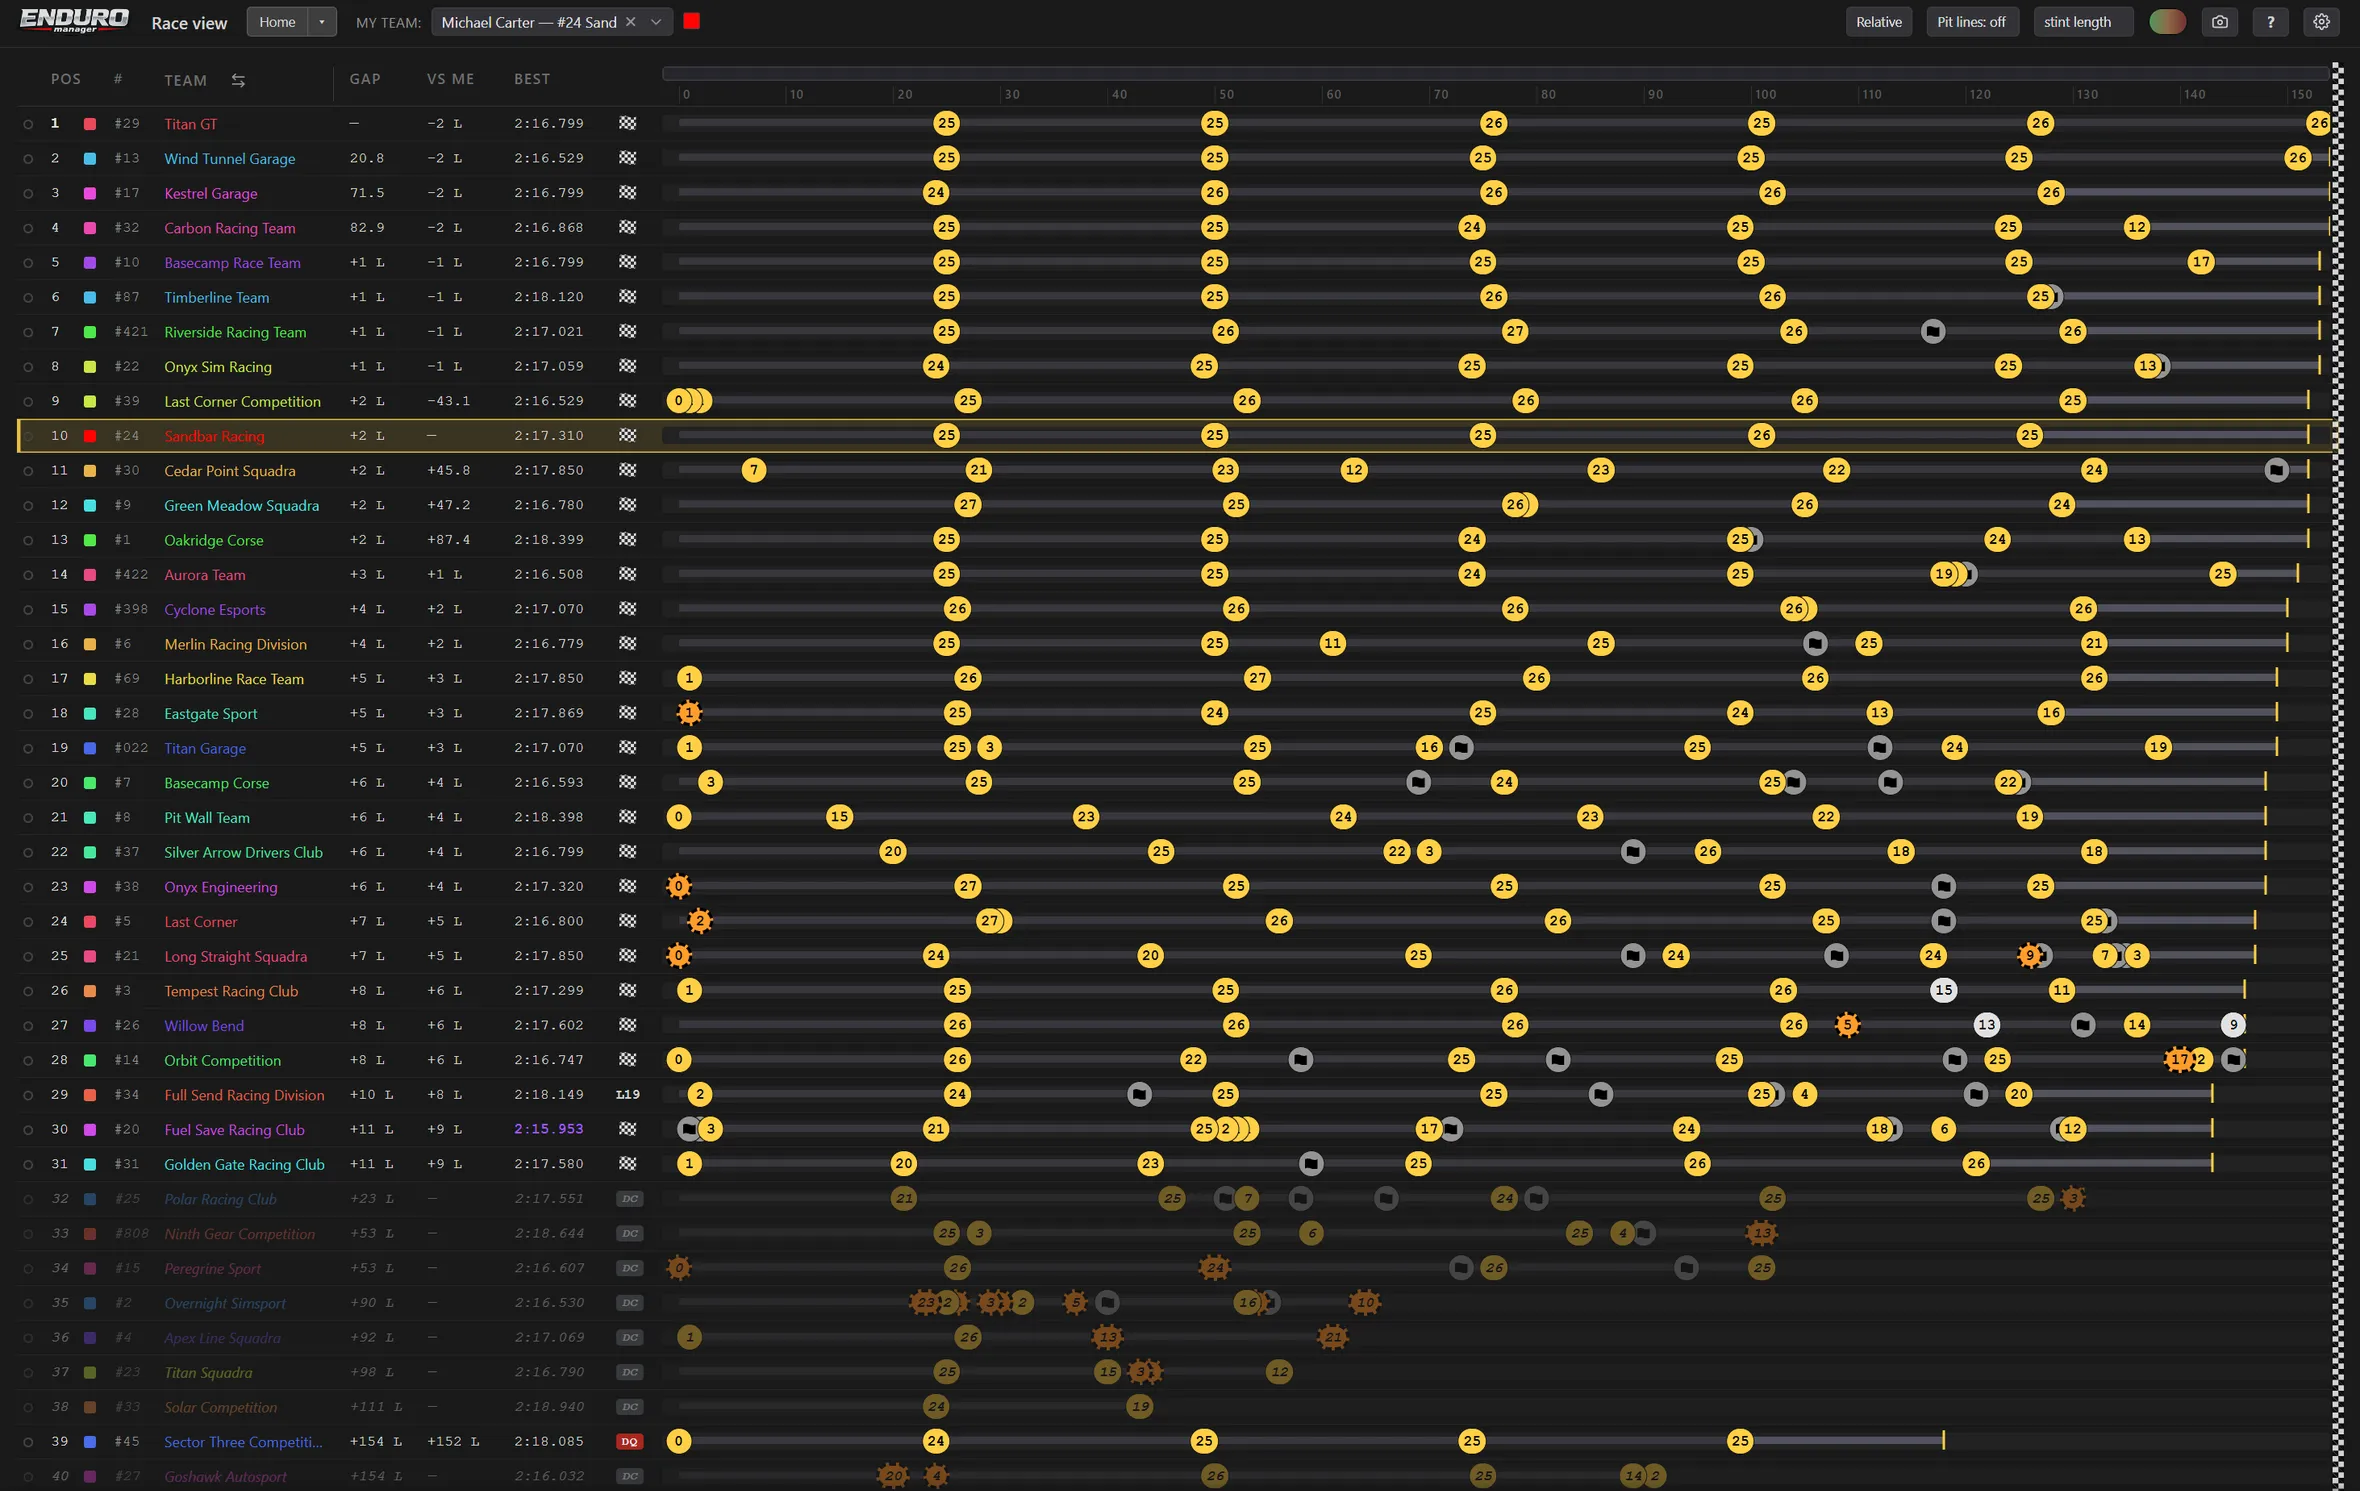
  • Is the car ahead on another strategy? See every car's pit stops, stint lengths and positions through the whole race.
  • Give valuable information to your driver. "Car ahead is triple stinting and on old tires. Car behind did a shorter pit stop than usual and runs less fuel than you".
  • Race view works in both standings mode and relative mode - so you can always give your driver the data they need for the global race or for his current fights on track.
  • Review your race and strategy after the race. Our timeline lets you go back to any time in the race, so you can see what data was available then and identify whether you made the right call.
  • In this 24h race - can you identify which team moved from double stints to triple stints after 14h of racing?
Race view: every car's pit stops over a 6-hour race, each marker showing the laps of the stint The same race with each pit stop marker showing the stop duration, colored from fast to slow A 24-hour multiclass race: every GTP car's 30-odd pit stops on one row each

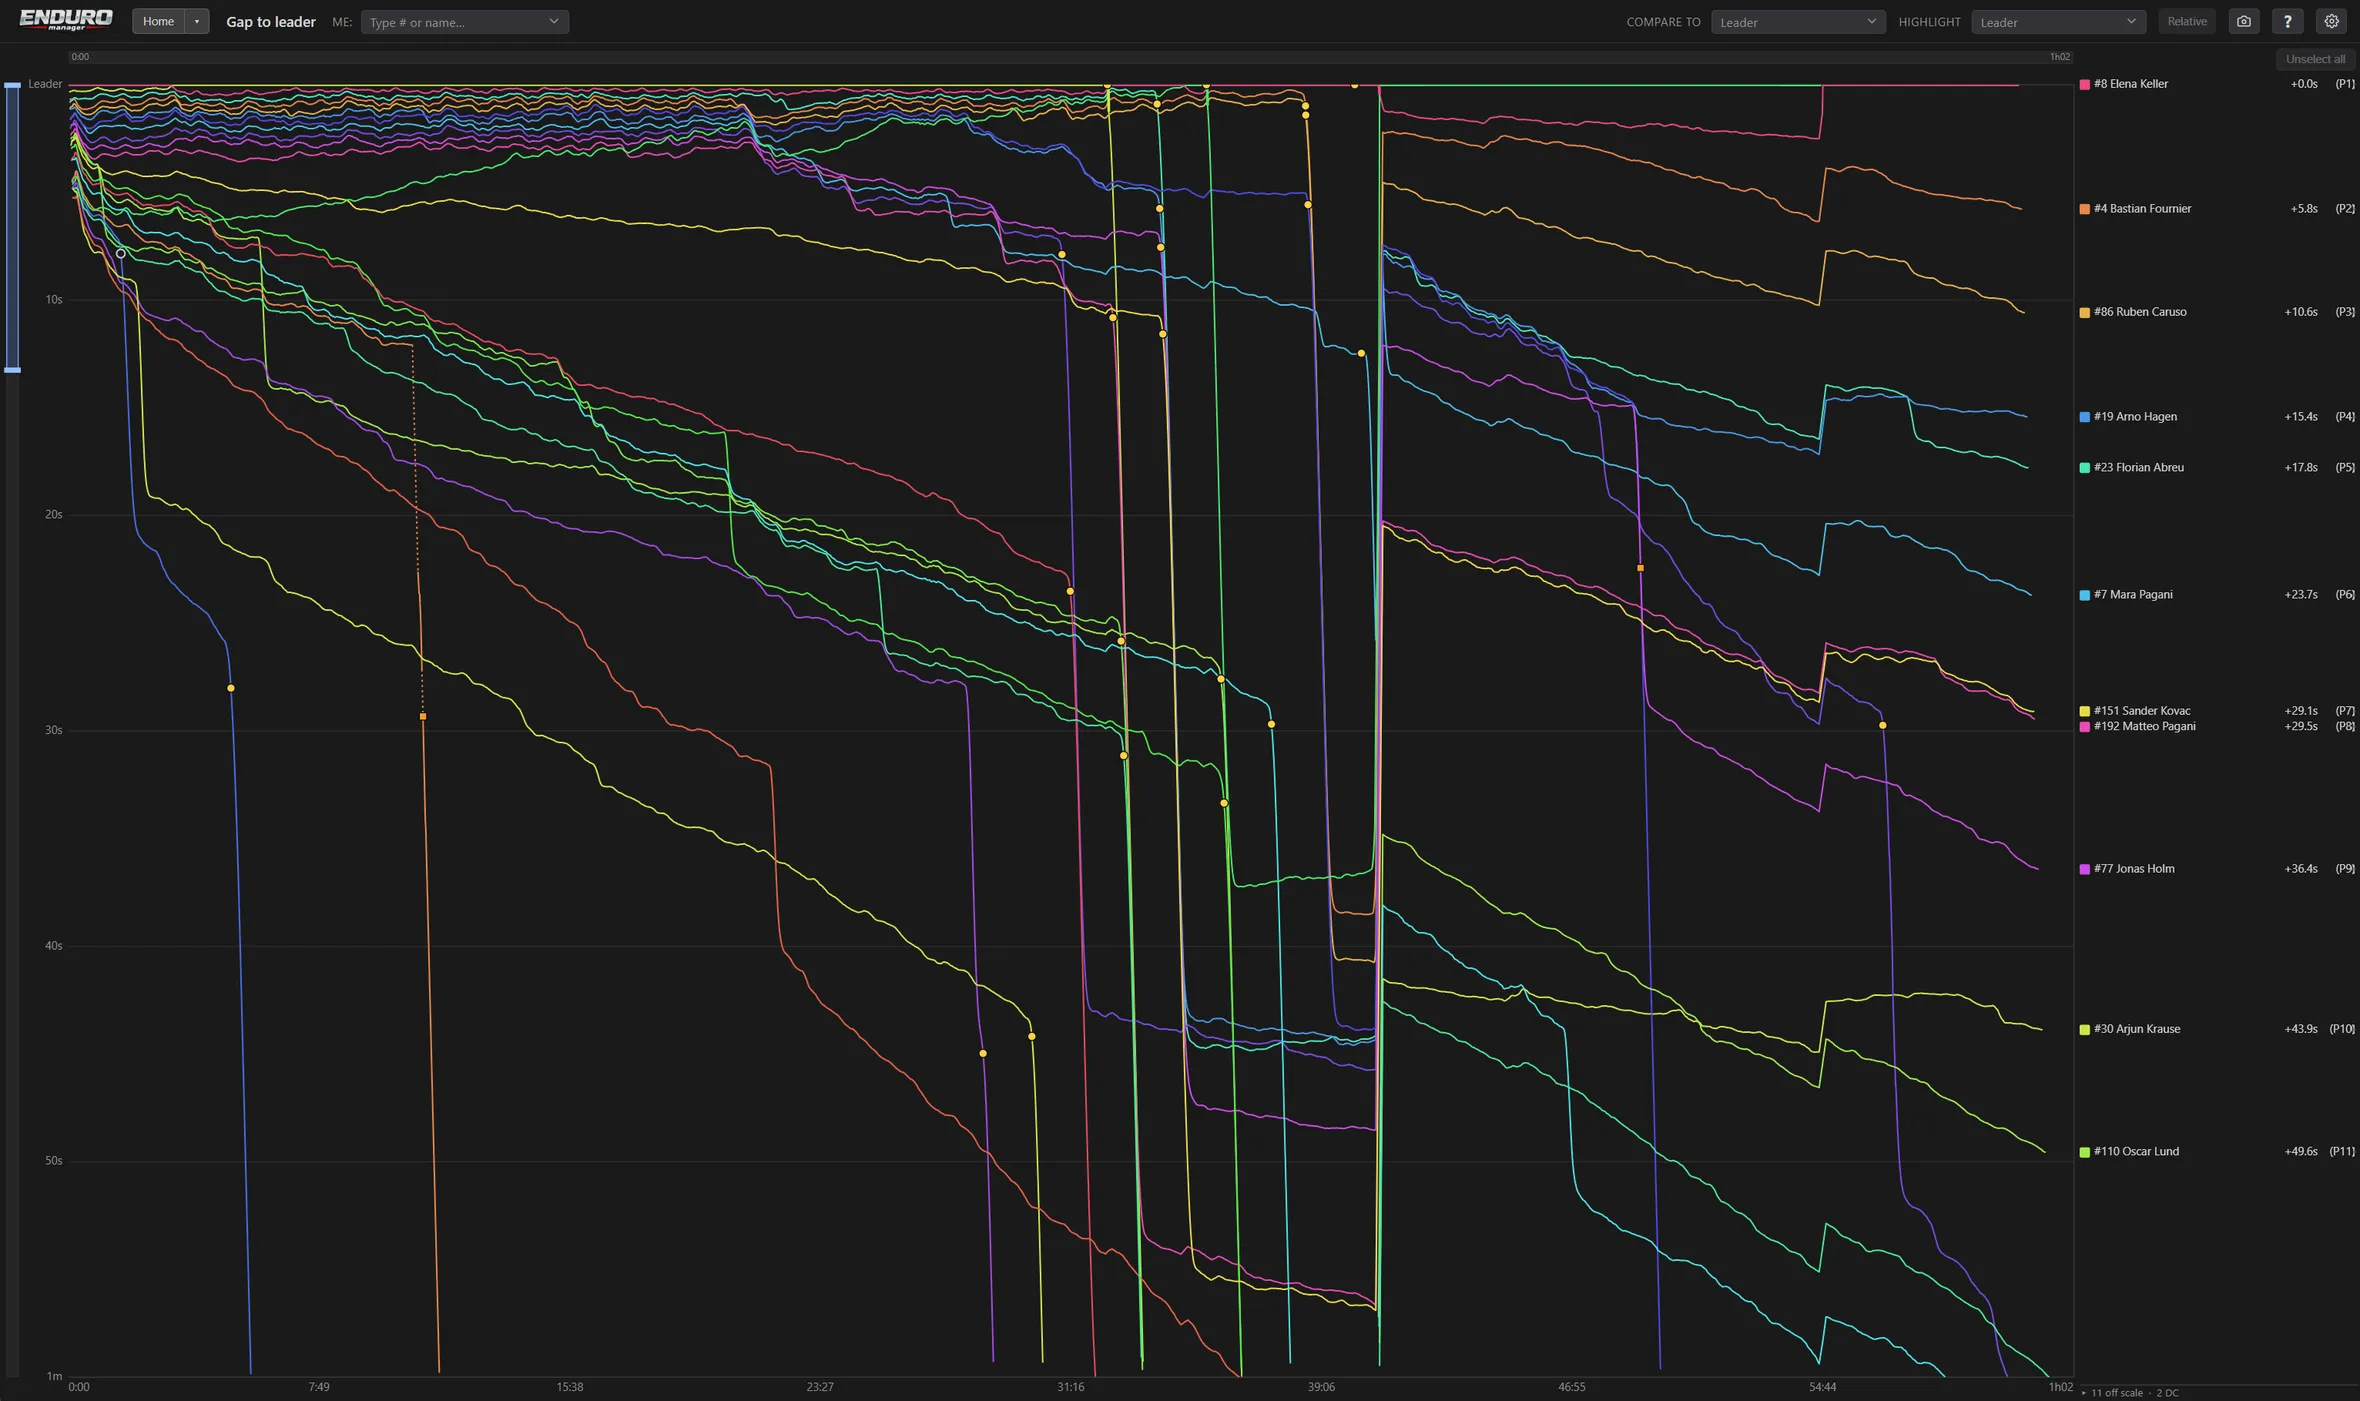
Gap chart

The gap to every car across the whole race - live and post race reviews

  • Live:
    • Identify pace difference between drivers. Tell your driver "car behind will catch up in 4 laps", or update your strategy consequently.
    • Find out what happened, identify if the car behind disappeared because of an incident or because it pitted.
  • Post race review:
    • Relive the race and understand what happened or why someone's strategy let them overtake you.
    • Share it with your friend, show them your race visually - show them the draft train you were part of, the slide that made you lose it, the pit strategy that made you win 2 positions...
Gap chart: one line per car, the gap to the leader over a 1-hour race, pit stops as steps

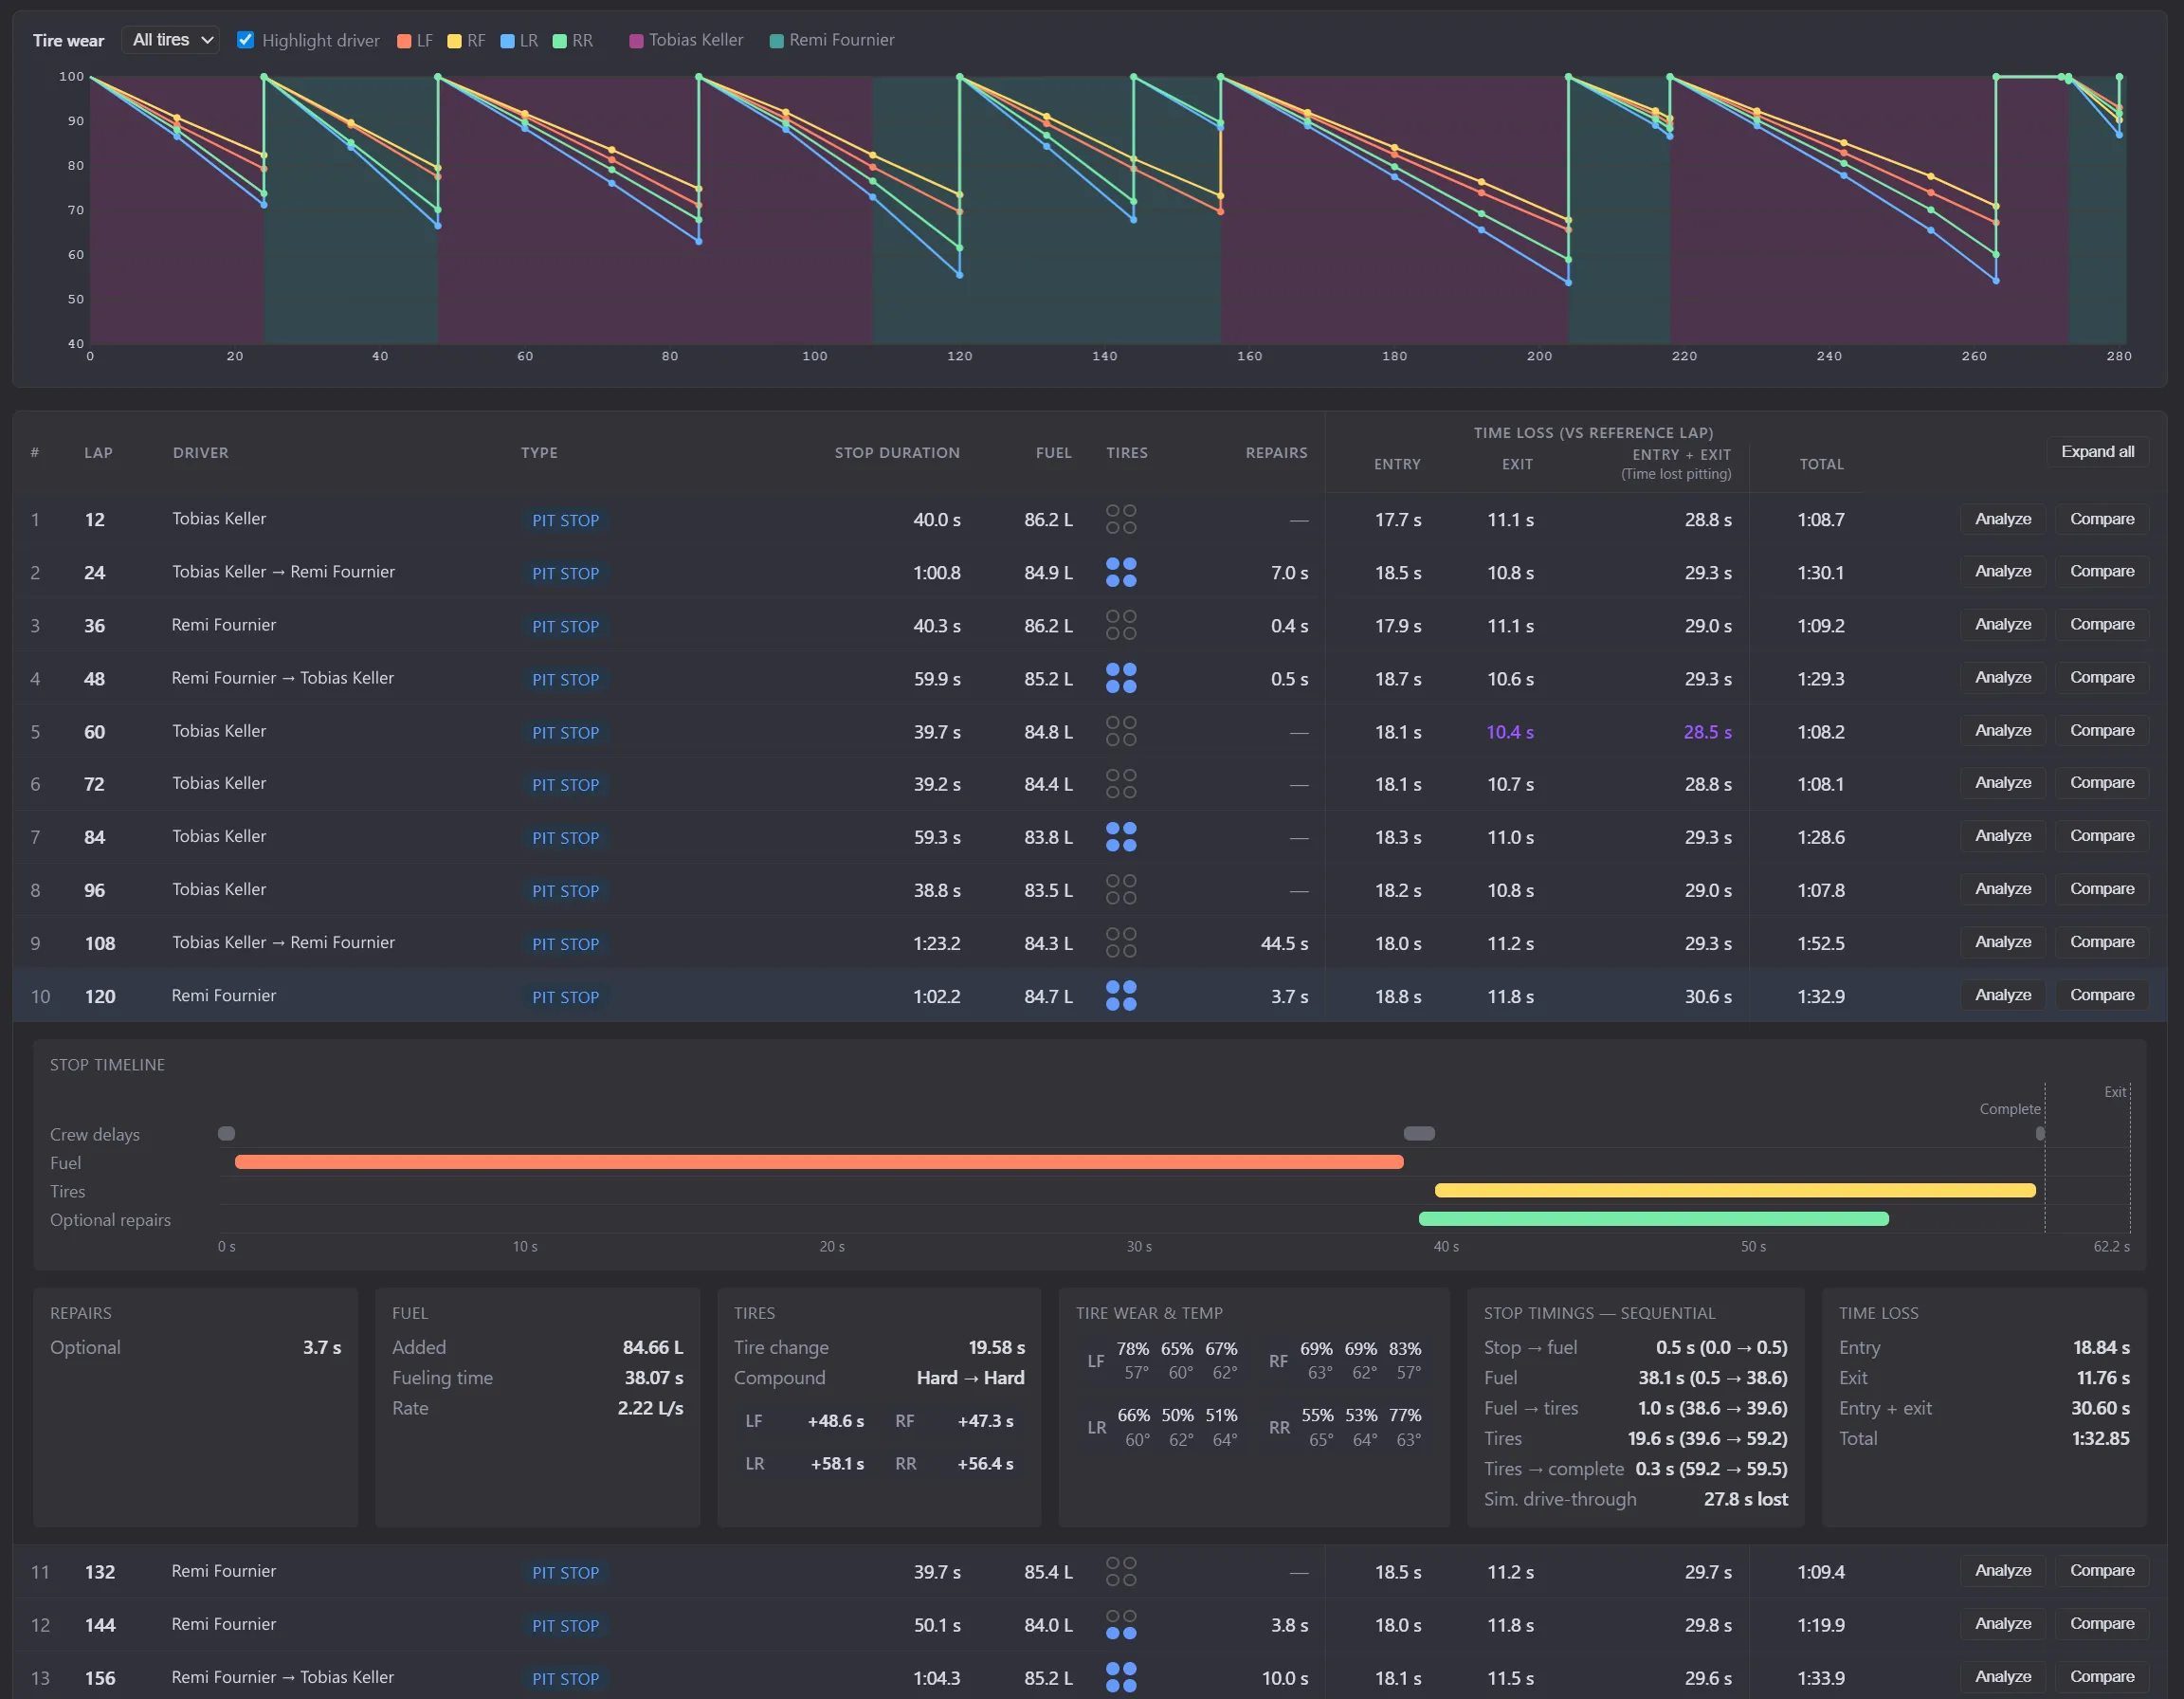
Pit Stop Analyzer

Every pit stop measured and analyzed

  • See your tire wear across the whole race.
  • Measure time lost on pit entry and pit exit across all drivers, and learn to save valuable time on entry and exit.
  • Prepare ahead of races: measure and save your pit stop data to make it available in your race plans.
Pit Stop Analyzer on a team race: tire wear per stint, then one row per stop with its duration, fuel, tires, repairs and time lost, one stop open on its timeline

Pit Stop Comparison

Races are won and lost in the pits. Don't overlook your pit stops

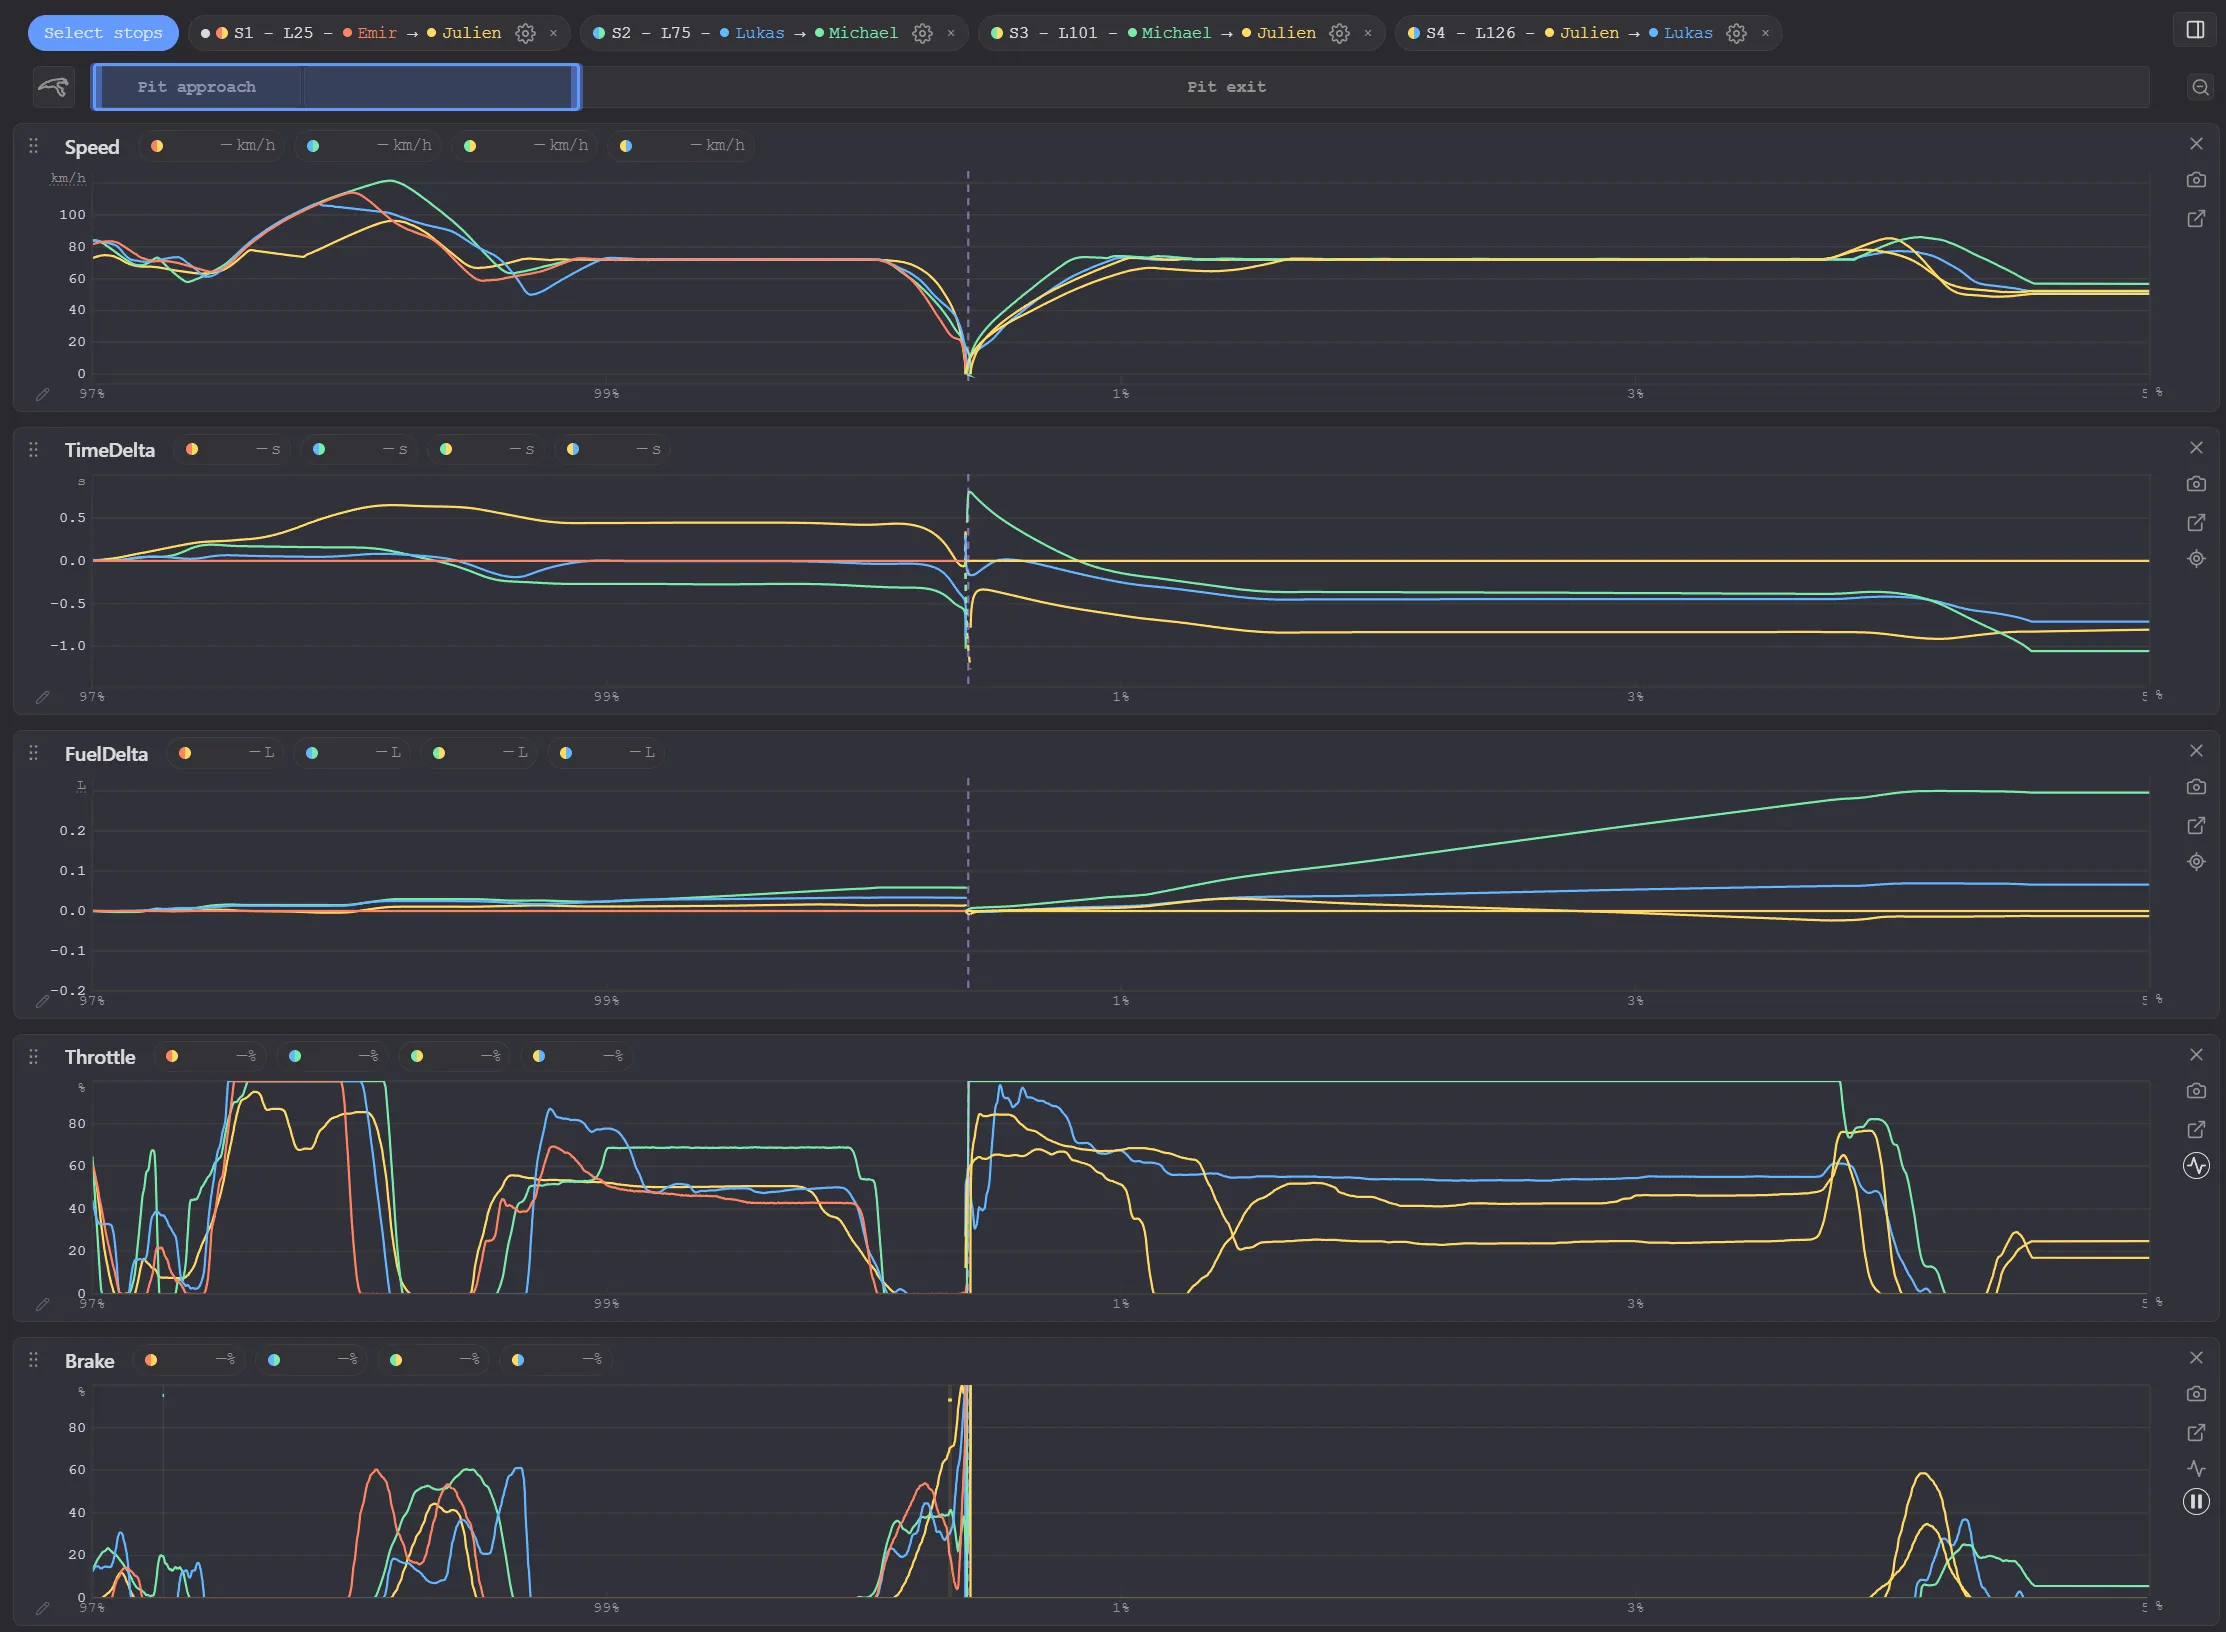
  • Our telemetry tools natively work for pit stops. Use our built-in pit stop layouts, or create your own layout to analyze your stops.
  • In team races, all the pit stops are available, including the ones with driver swap. Color the charts per stop or per driver.
  • Find out extra fuel used in the pit lane and improve your team's overall fuel usage. See in the example a driver who used 0.3 L more than his teammates.
  • Find out which driver is the fastest in the pits, understand why and get the whole team to be faster.
Four driver-swap pit stops of a team race compared from pit approach to pit exit: speed, time delta, fuel delta, throttle and brake

Lap Compare

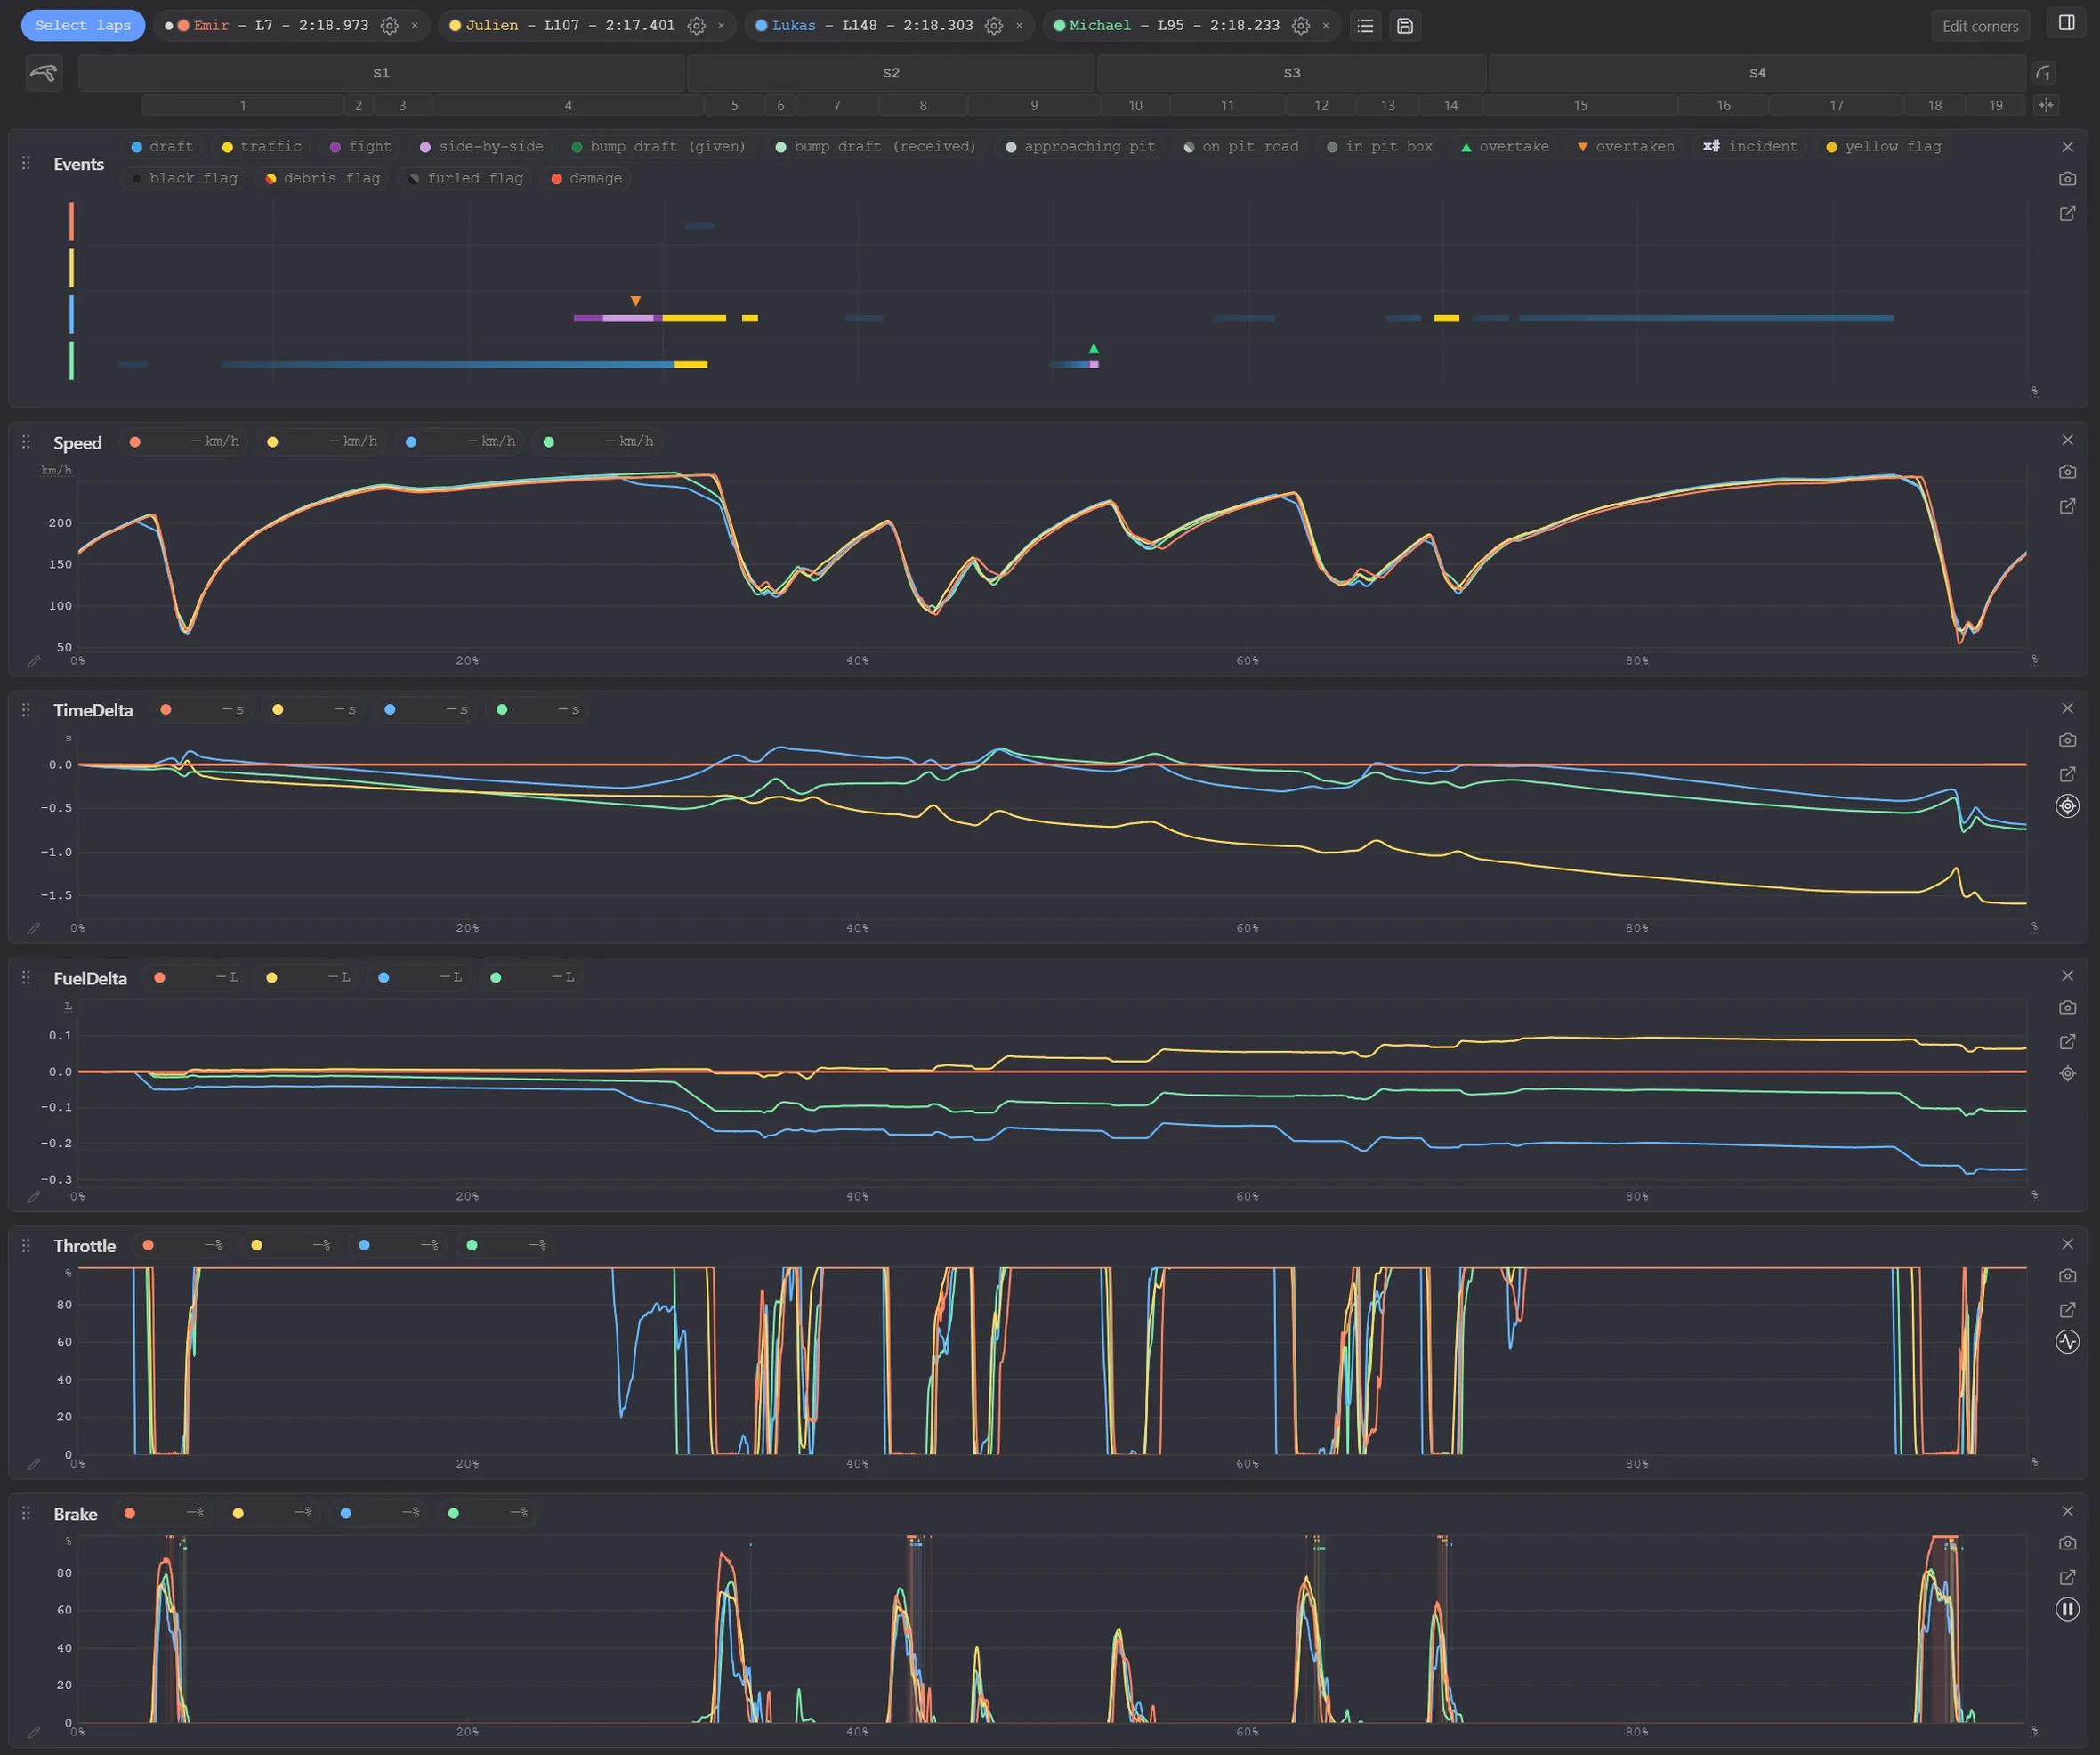
Compare telemetry across 250+ variables

  • Our telemetry tools have never made easier to compare your telemetry across laps. Use one of our built-in layouts, or build your own.
  • Our innovative custom variables give you valuable insights: Brief pedal overlap on the pedal charts is almost invisible, but knowing that you have 3.4 s of pedal overlap across a whole lap is data that you can act on.
  • We show you all the context information you need to compare laps: draft, traffic, overtakes, track conditions... all is there to give meaning to the data.
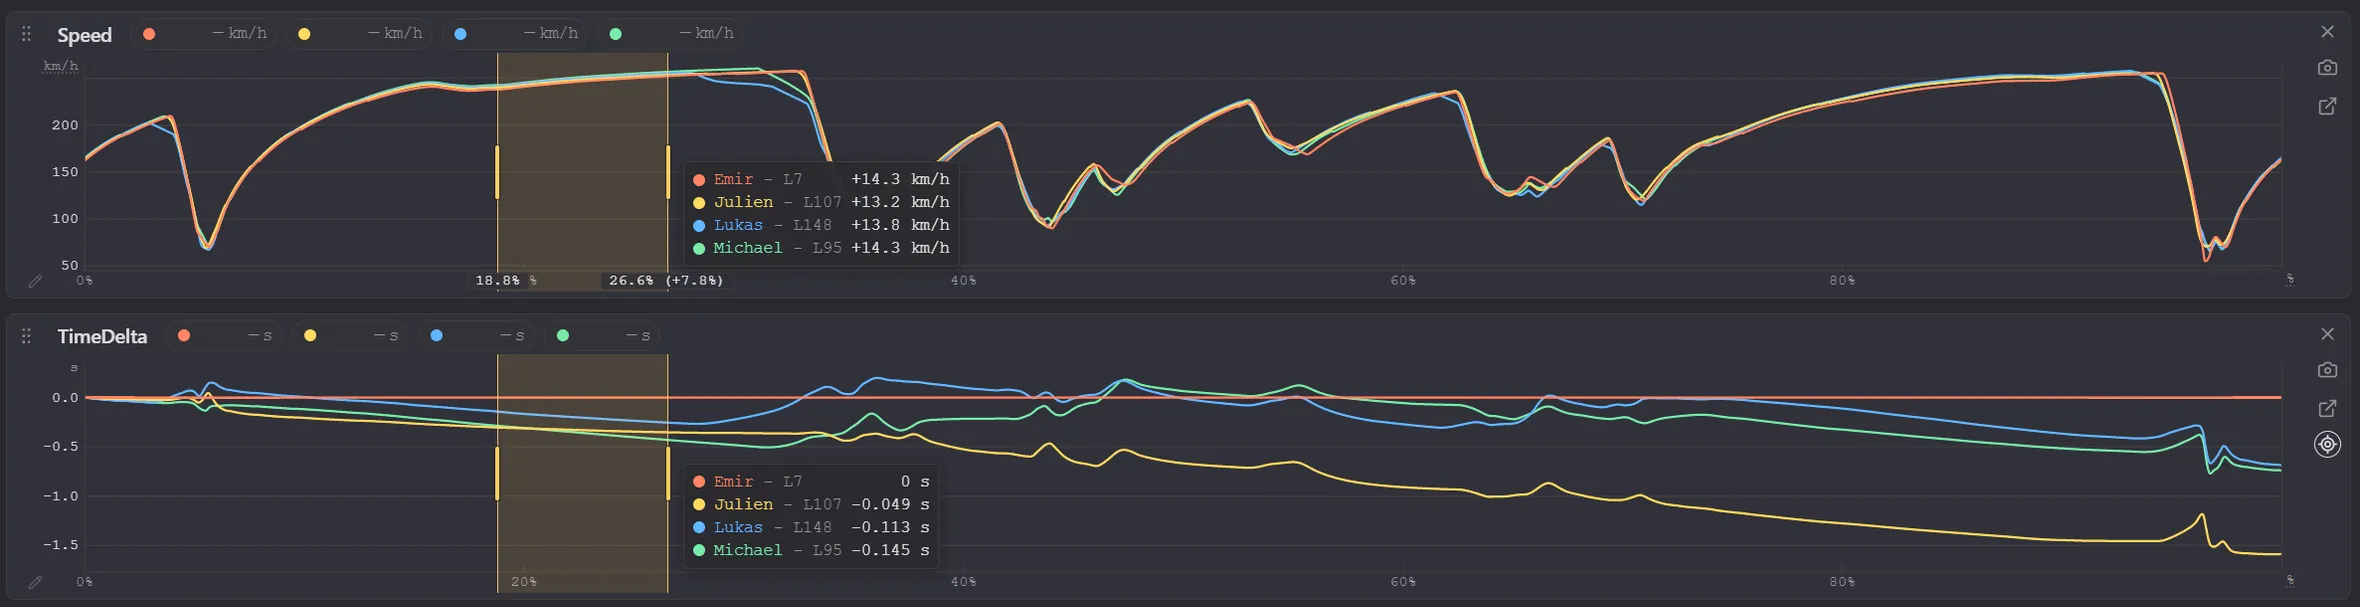
Four drivers' laps of a team race compared: events, speed, time delta, fuel delta, throttle and brake Speed and time delta with a part of the lap selected: each driver's difference over that part

Telemetry Explorer

Deep dive on your telemetry

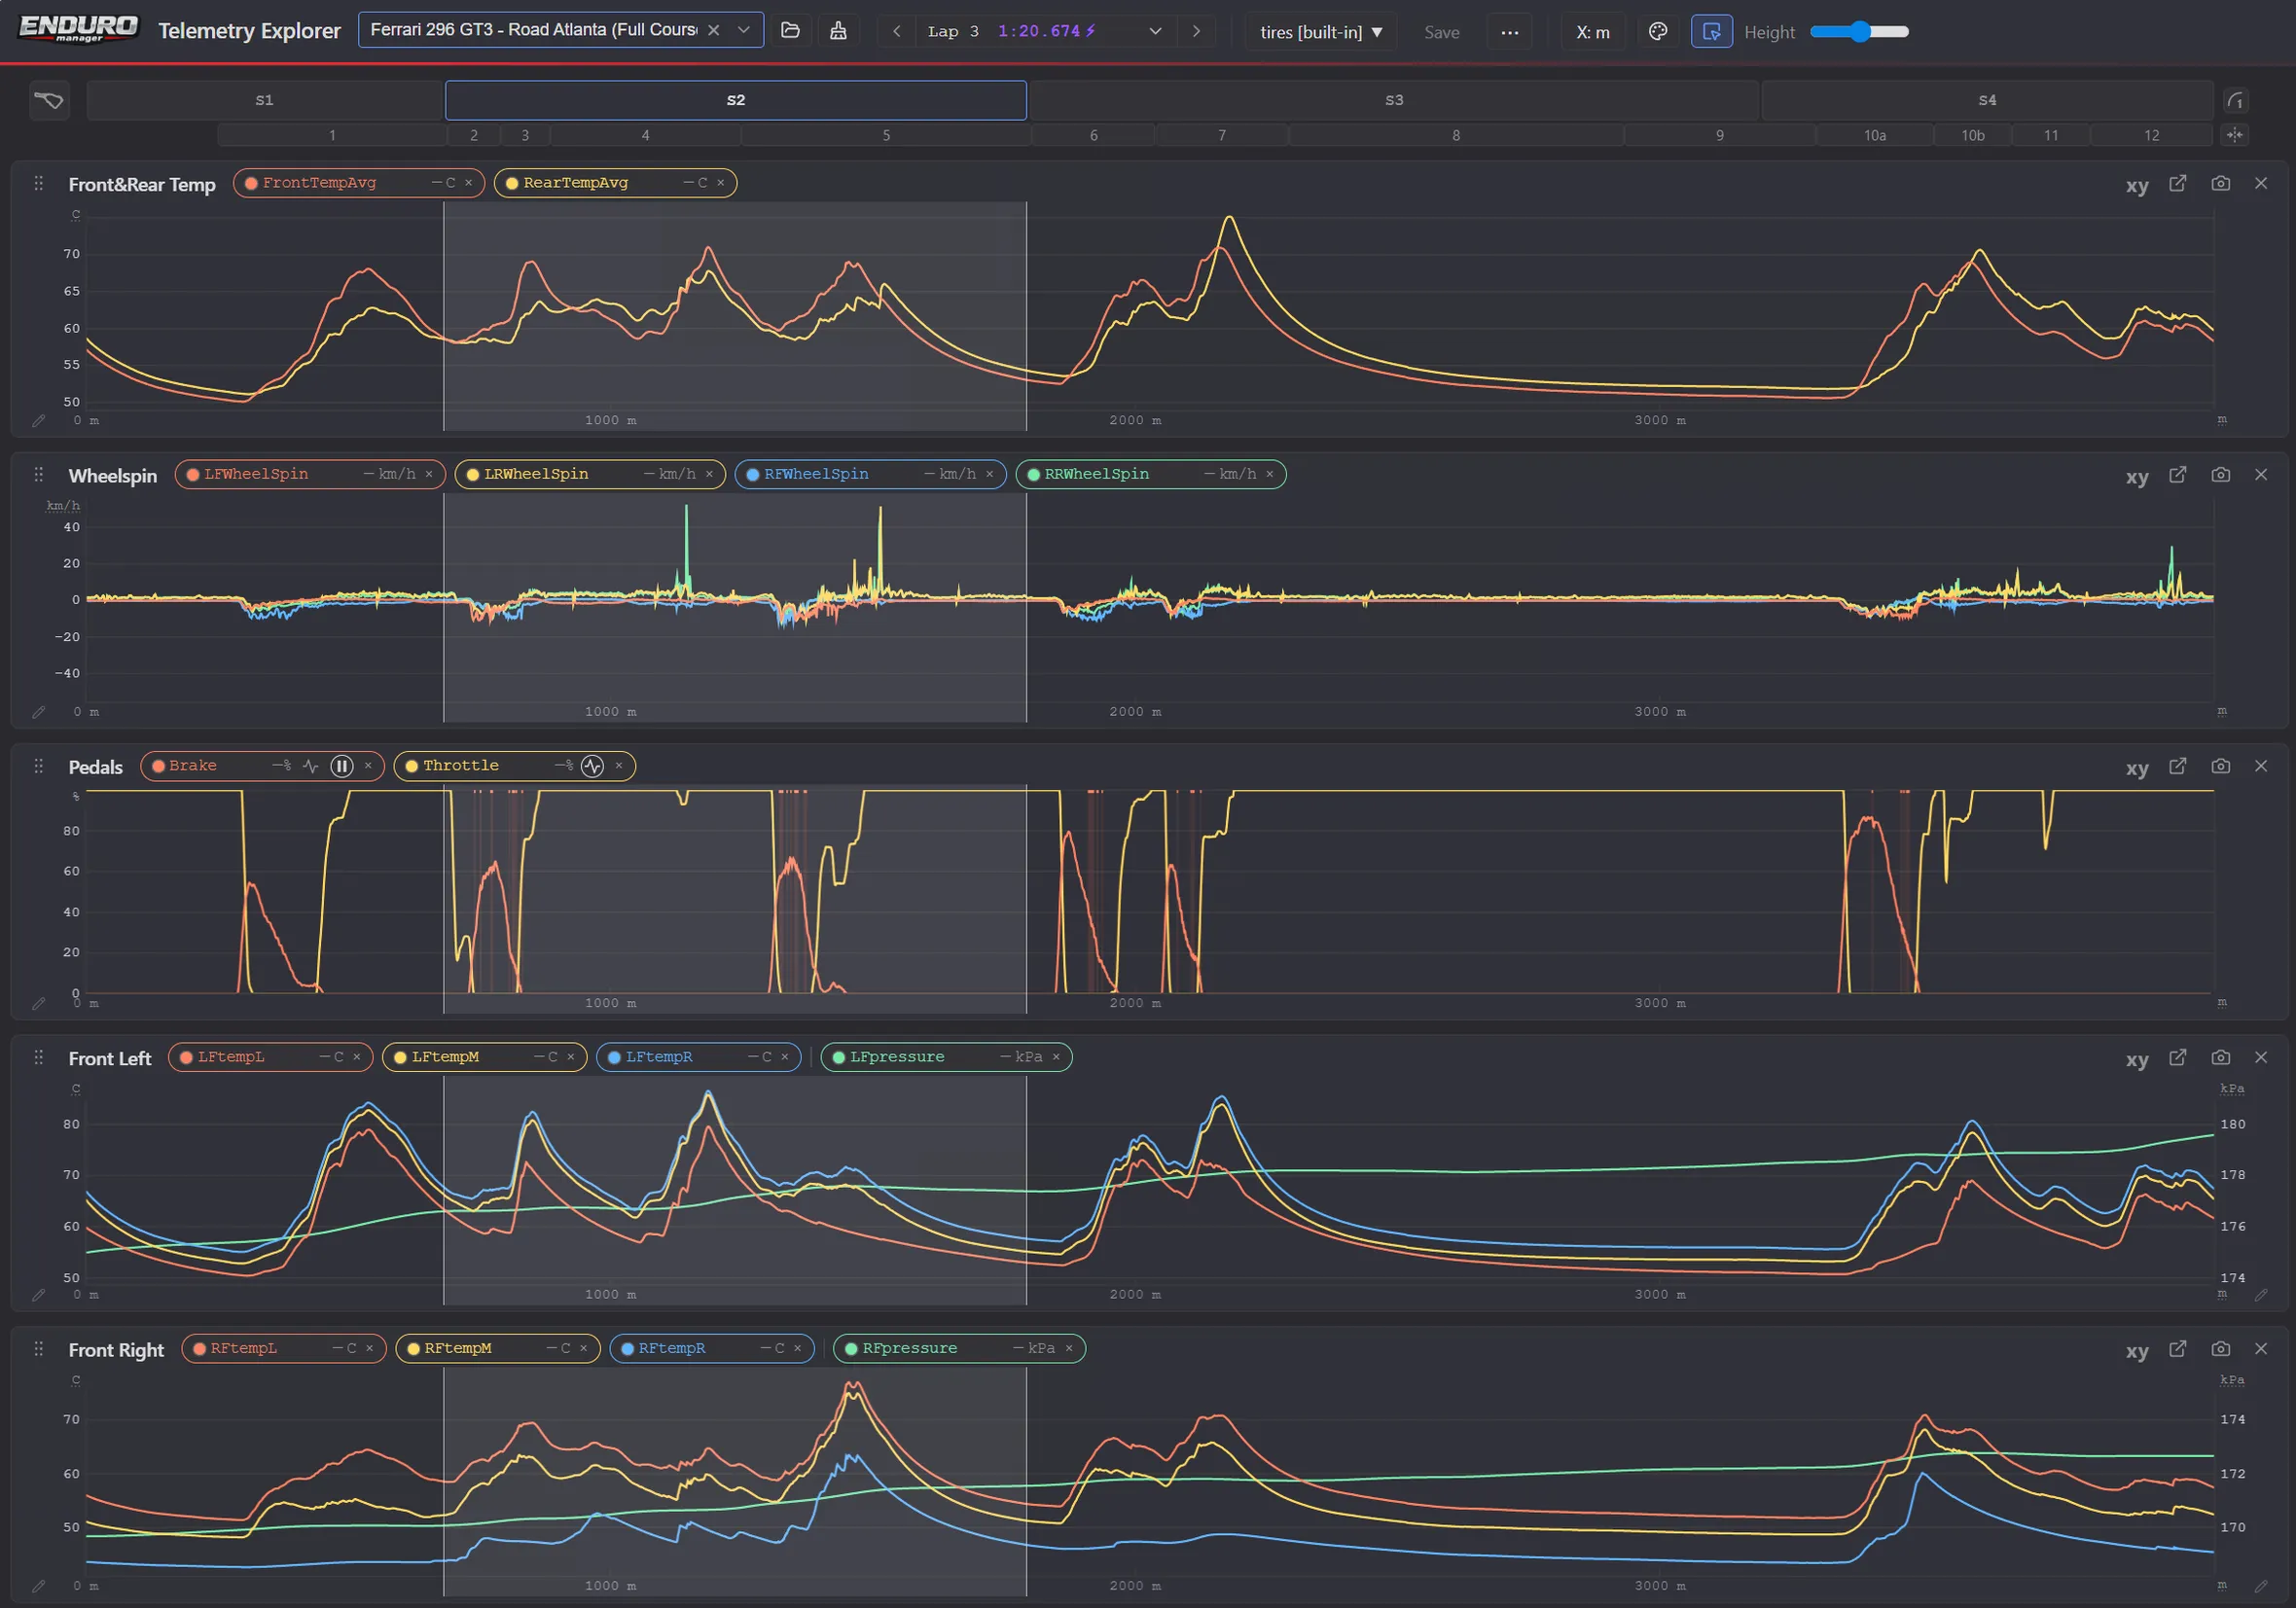
  • Most telemetry tools are hard to use and don't match our expectations anymore. We made our telemetry tool incredibly easy to use, with full customization capabilities, and innovative features to help you identify learning opportunities.
  • Build your custom layout to see exactly what you want.
  • We have corner numbers and names for over 250 track configurations - click on any corner to analyze your performance there.
  • Our track maps, as well as satellite view [preview] are synchronized with the charts, making line comparison very easy.
  • Still have the replay? See your telemetry synchronized with the replay - the best way to make sense of the data with what actually happened on track - any crest, compression, curb will now make sense.
Telemetry Explorer: tire temperatures, wheelspin, pedals and tire pressures over one lap, the second sector selected

Standing start analysis

Improve your standing start performance

  • A strong start can make the difference between having enough overlap by T1 to overtake, or having to stay behind. Don't neglect it!
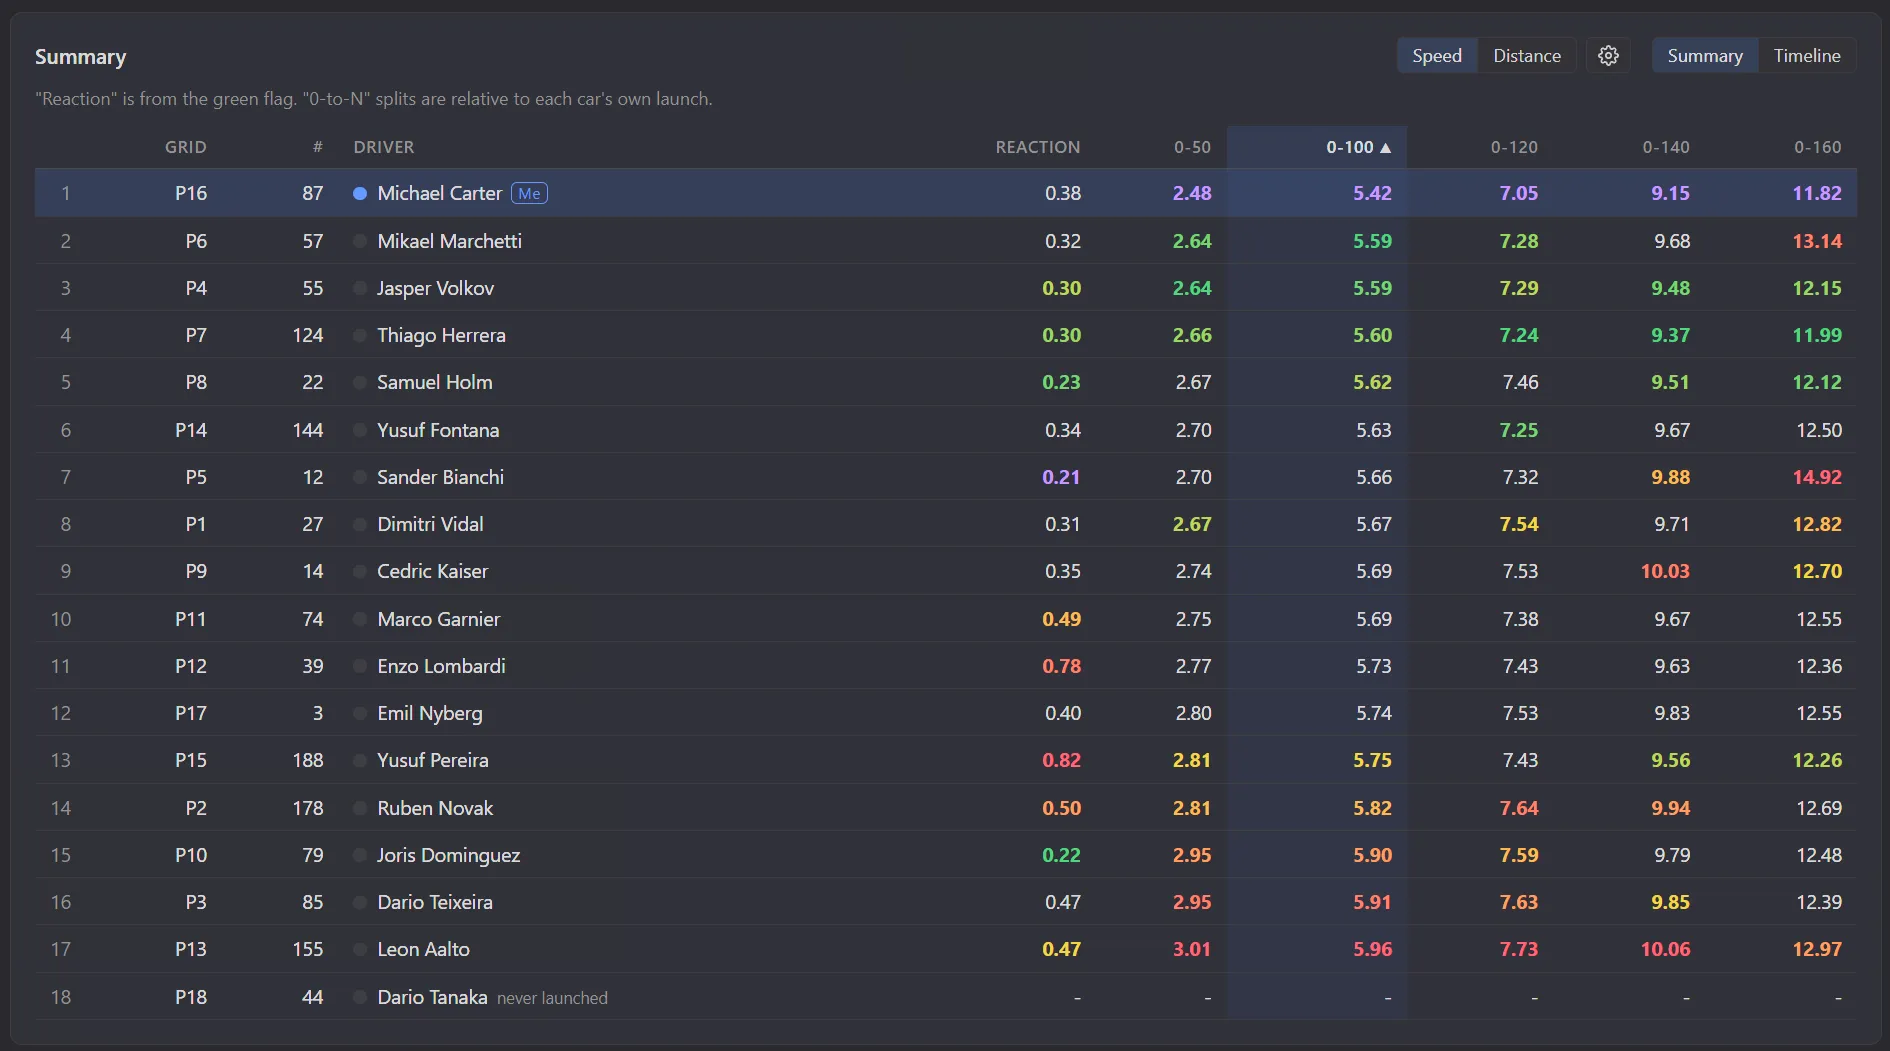
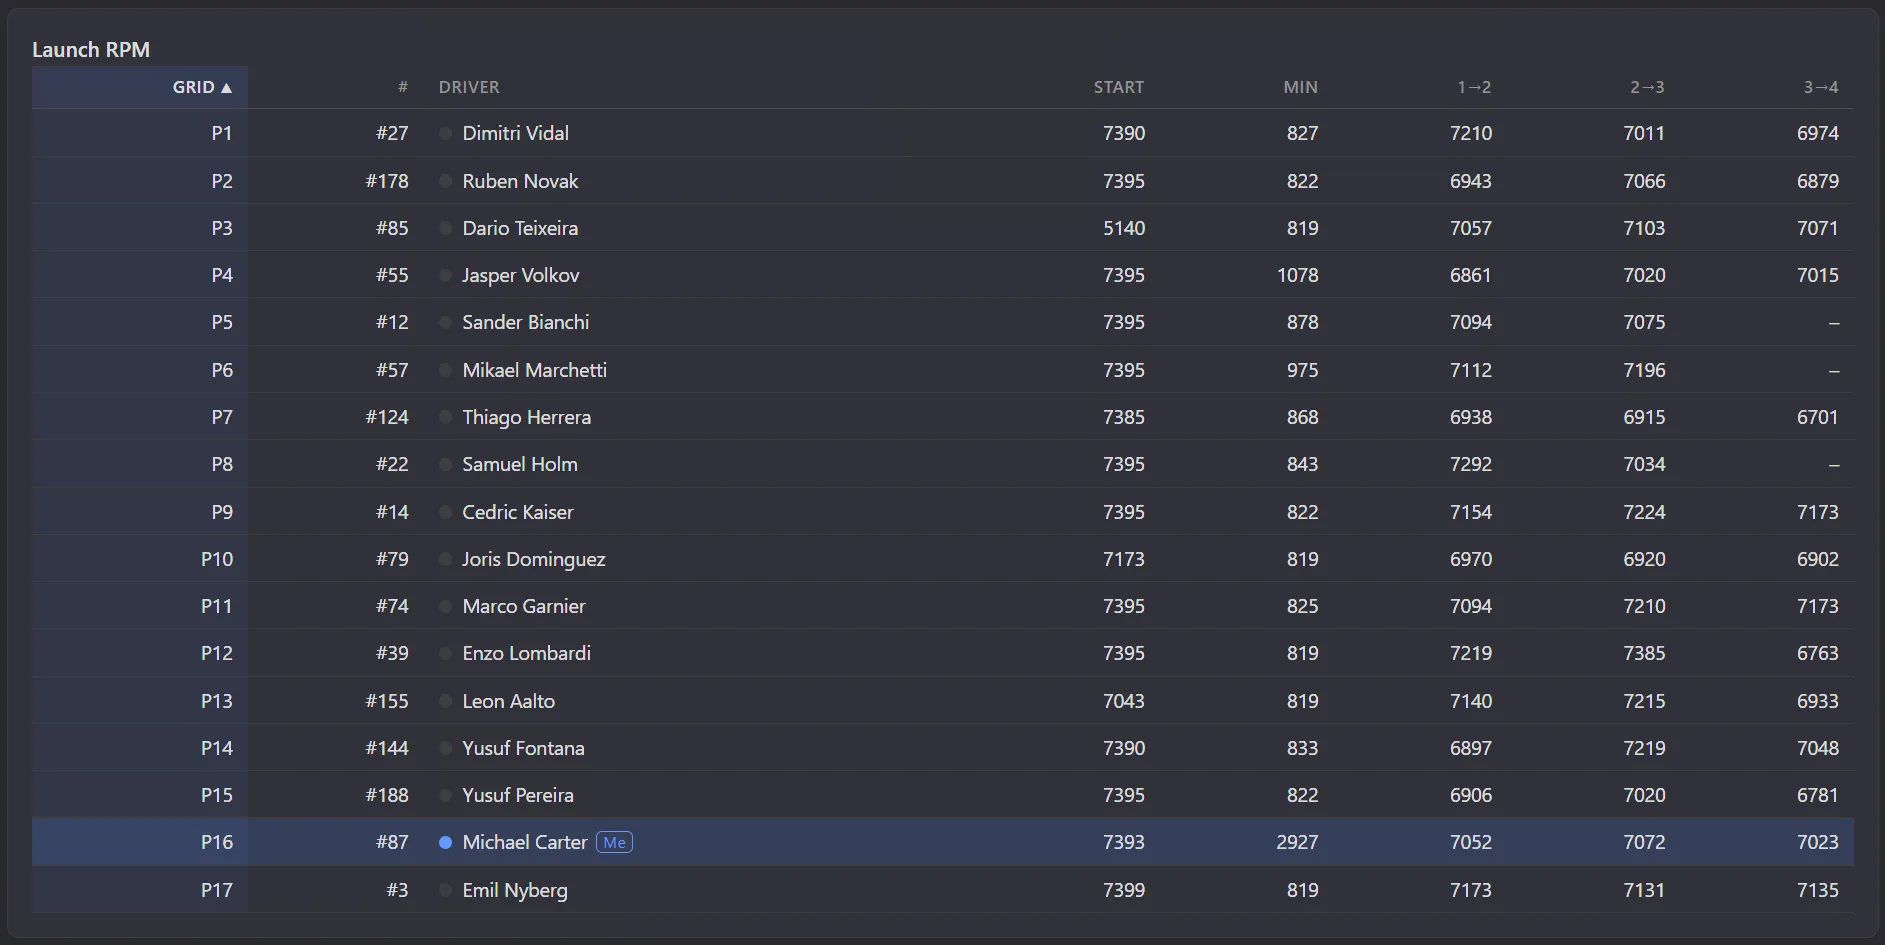
  • See how your standing start ranks across all drivers. Deep dive in the data to see who has a fast reaction time, who has a great jump over the first meters, who is the fastest from 0 to 100, and who gets an advantage while shifting.
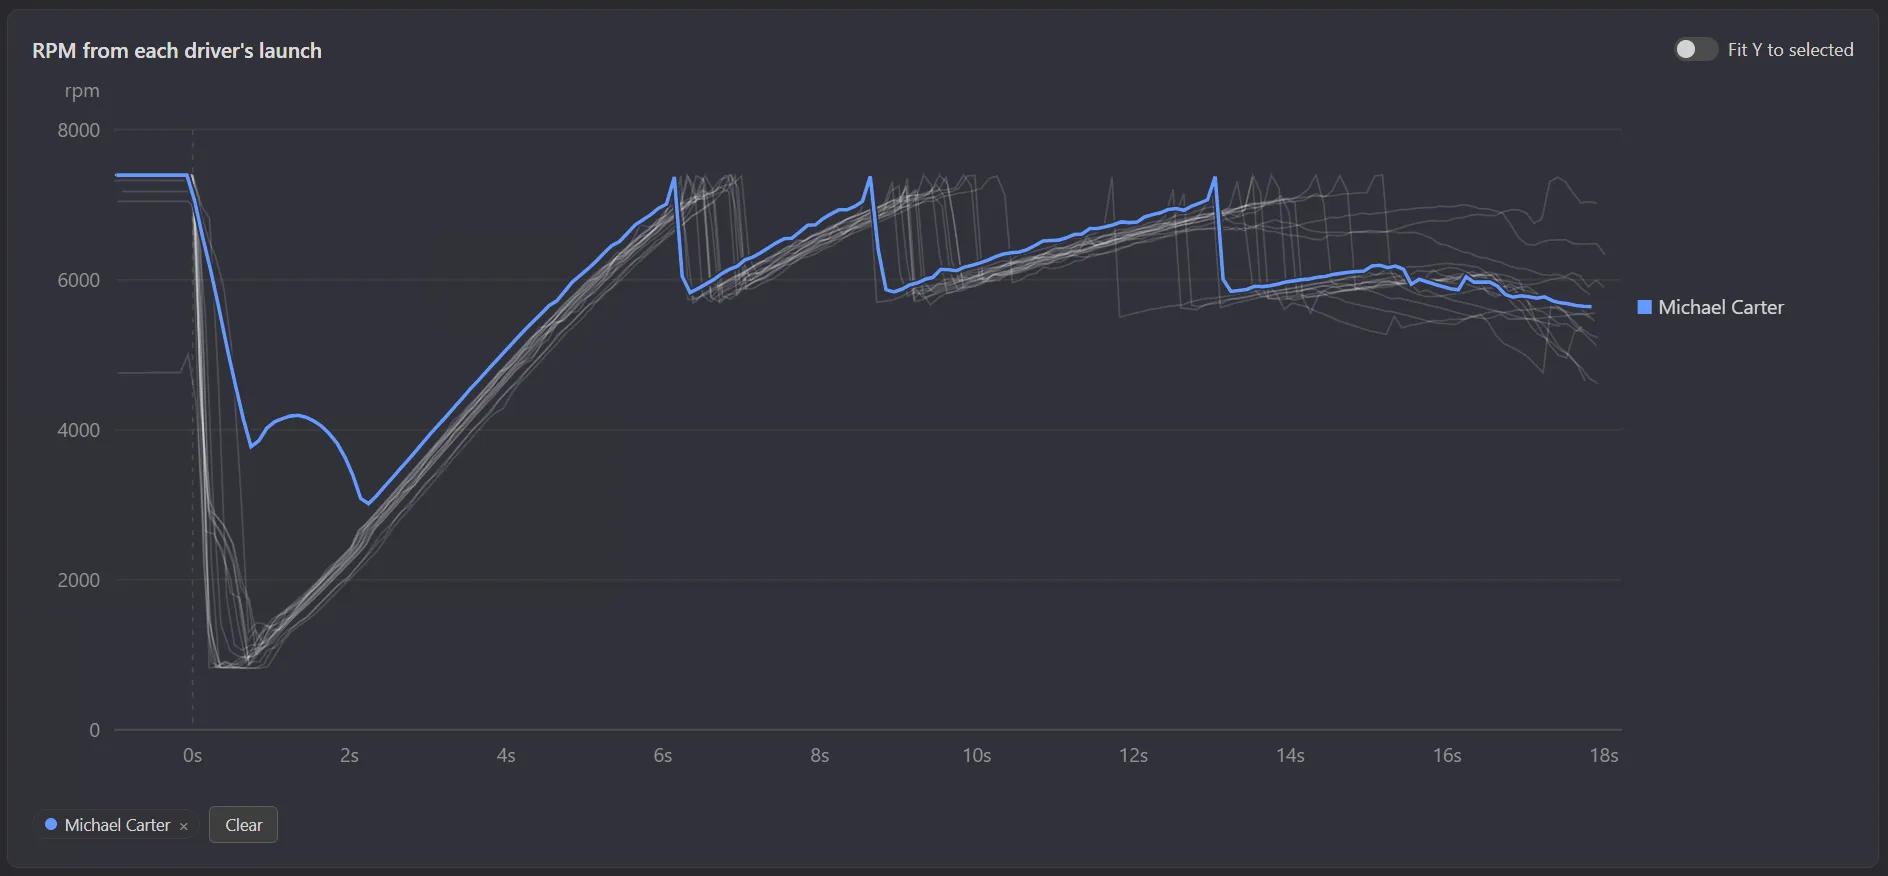
  • The RPM data for all drivers is available for deeper analysis. Find out how the fastest drivers drop the clutch: bite point, RPM optimal range, shift point... Then start practicing your own technique!
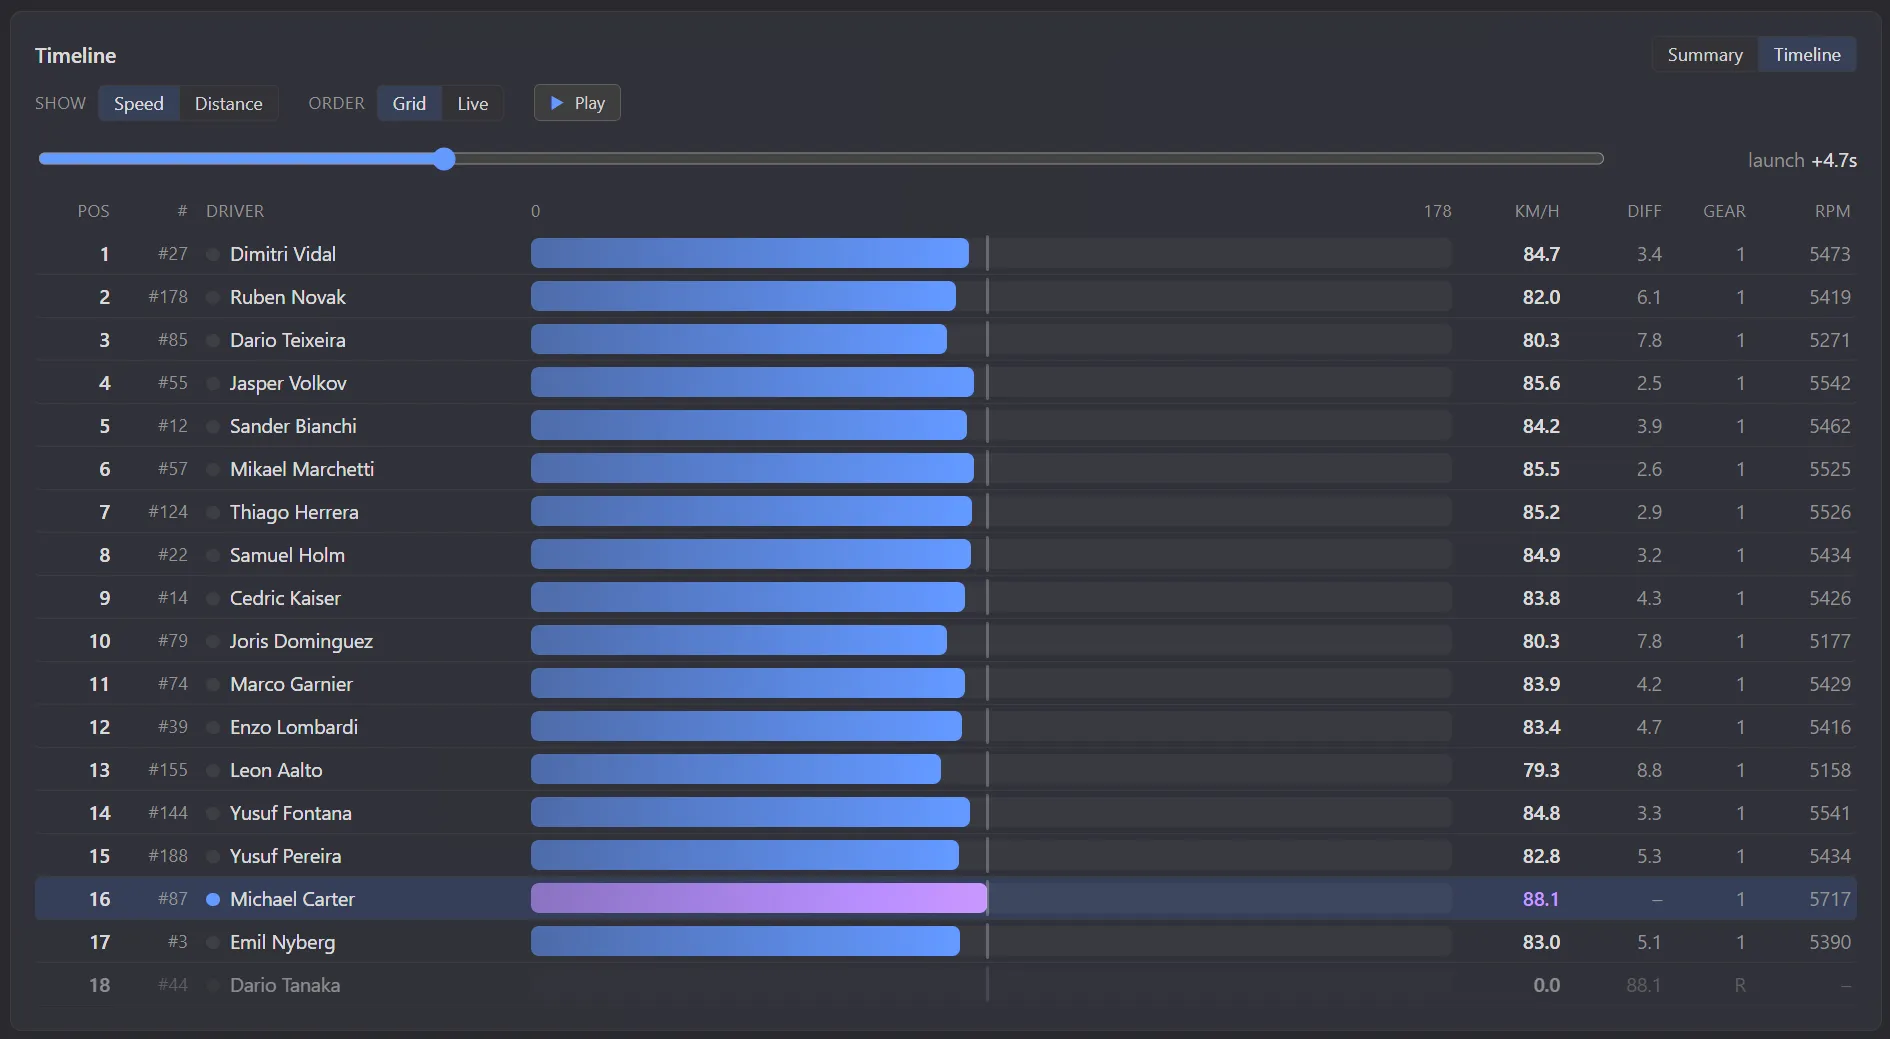
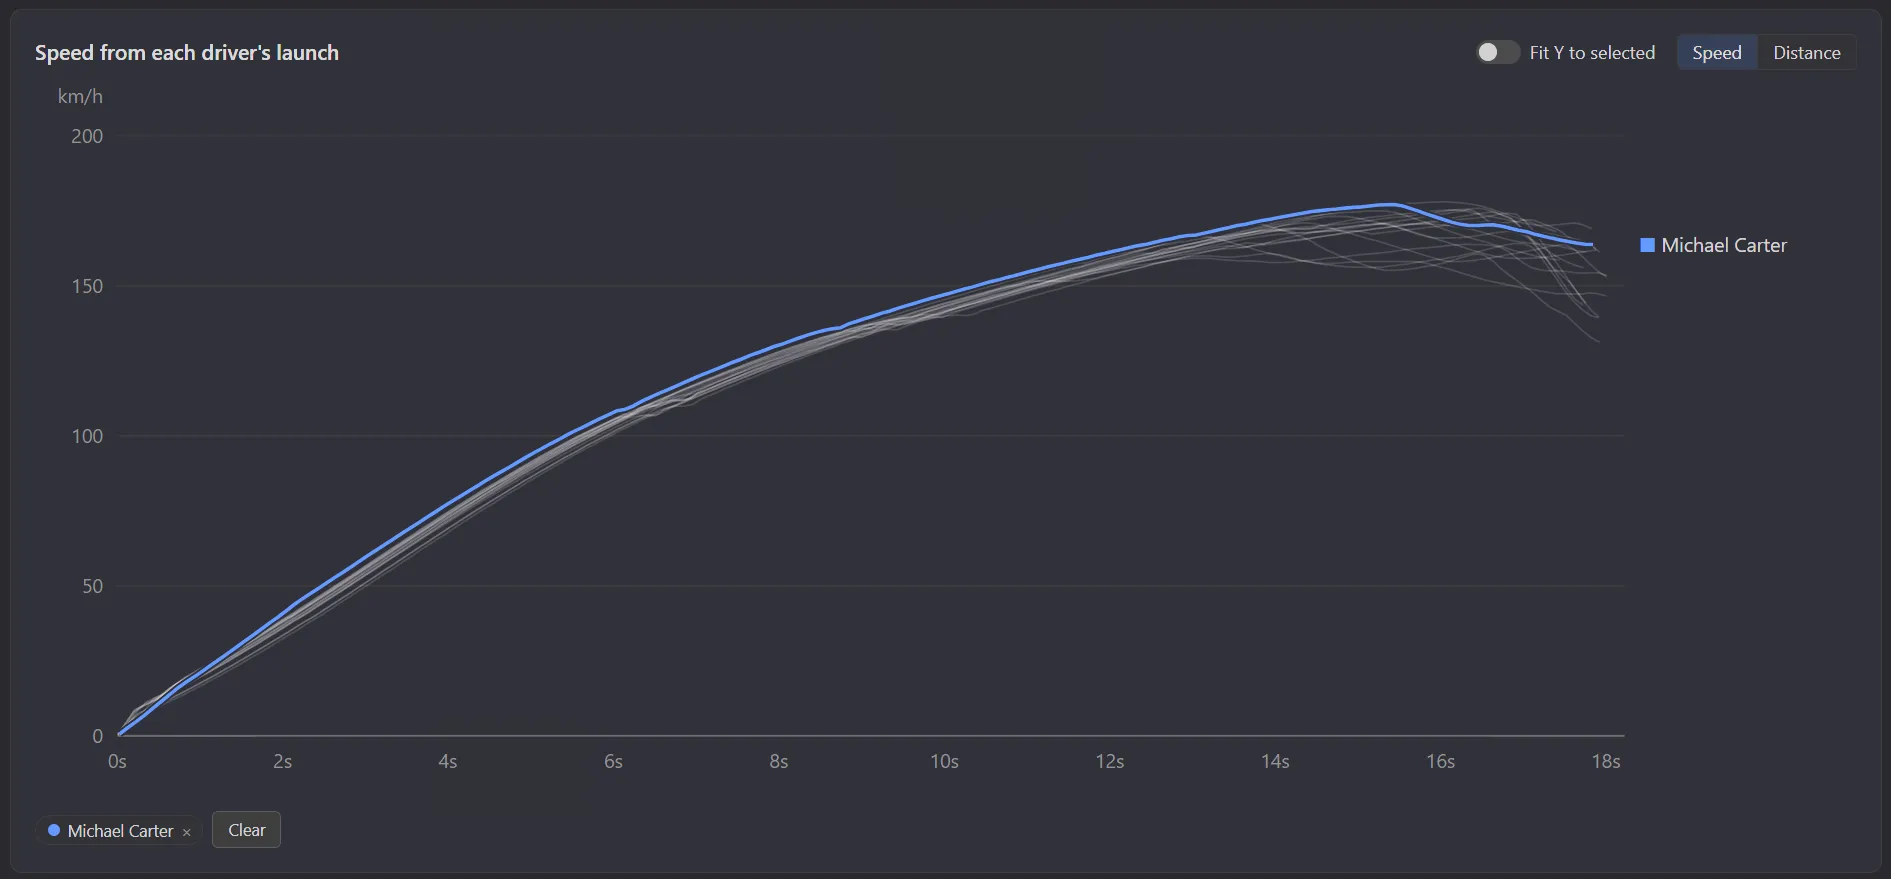
Standing start summary: every car's reaction time and times to 50, 100, 120, 140 and 160 km/h, sorted by 0-100 km/h RPM from each driver's launch: one line per car, one driver highlighted The start replayed: each car's speed, gear and RPM 4.7 seconds after its launch Speed from each driver's launch: one line per car, one driver highlighted Launch RPM: each car's RPM at the start, its lowest RPM and the RPM of each upshift

Optimal shift point

Find out exactly what the optimal shift point is for any car

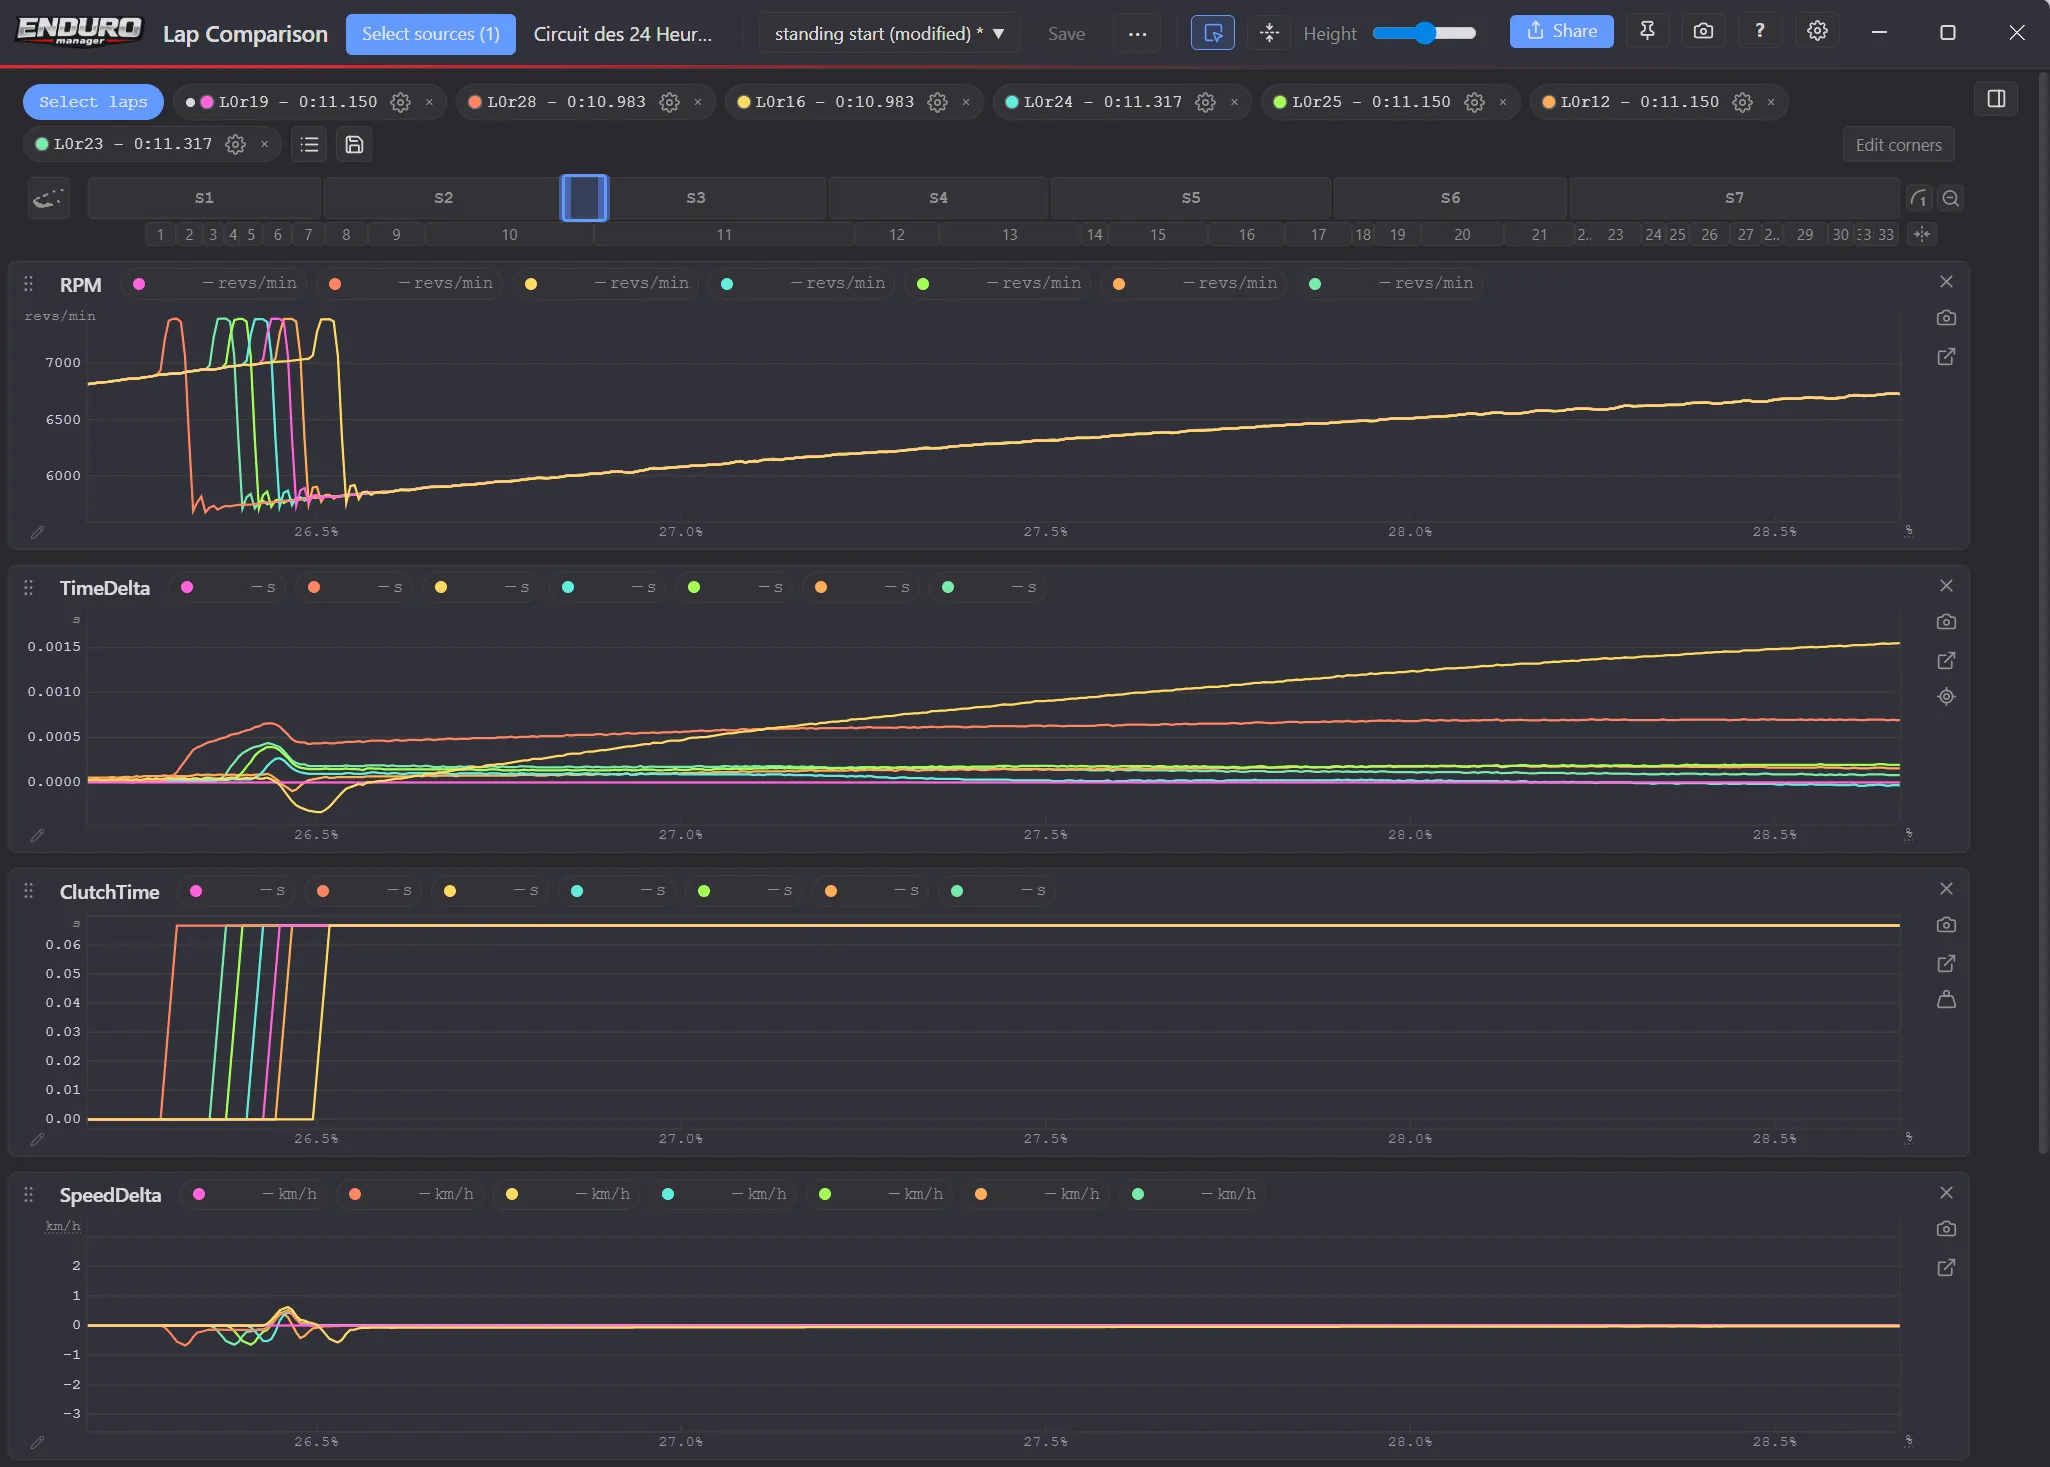
  • Our lap comparison tool supports active resets.
  • Active reset as much as you want, each time using a different shift point, until you find what's optimal. Based on real sim data, not just a reddit post.
Lap Compare over seven standing-start attempts: RPM, time delta, clutch and speed delta around the first upshift, each attempt shifting at a different RPM

Live driver telemetry

Compare your telemetry against other drivers during a live race

Limited data available
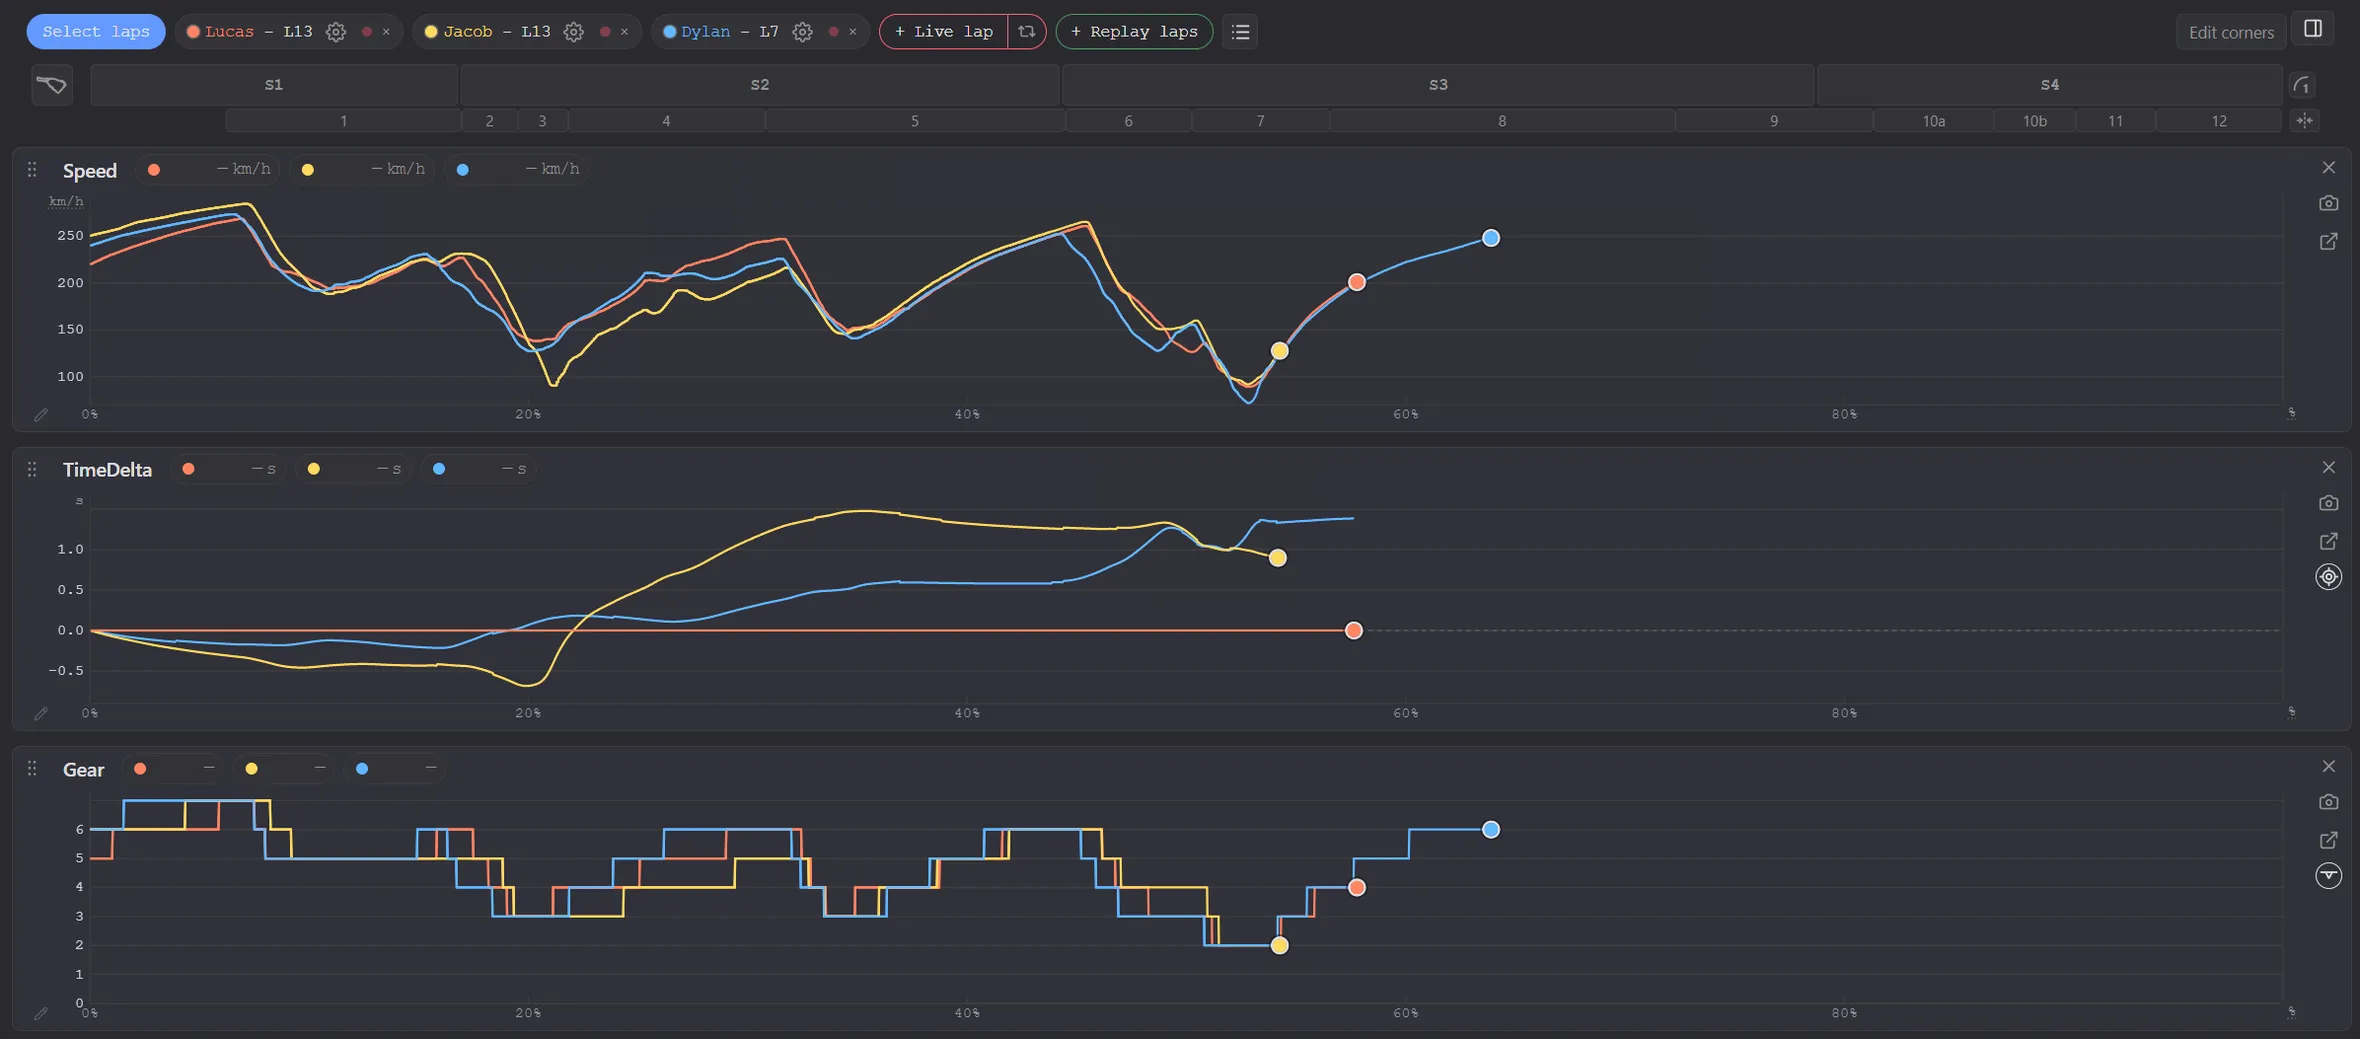
  • Your teammates can compare your telemetry data with the cars around you, during a live race.
  • Find out where you are slower, faster, look at the actual timeDelta live, and see what gear and shift point every driver uses.
Lap Compare on three live laps: speed, time delta and gear, each car's marker at its position on track now

Auto fuel Beta

The most powerful and accurate auto fuel on the market

  • Most auto fuel tools look at your recent laps and try to guess how much fuel you'll need. Or they let you set a "0.5 lap margin" - but have you ever driven half a lap? Read below to see how our auto fuel is better.
  • Our auto fuel computes the full race until finish. It knows about the pace of each car, every event that occurred, the pit stops each car still needs, and builds a statistical model to predict exactly what's going to happen.
  • The leader's white flag is borderline on lap 55 or lap 56? Our statistical model knows, and will tell you that your final lap might be on lap 56 (31% chance) or lap 57 (69% chance).
  • Make your pit stops short and don't carry dead weight! If you need 15.2 liters of fuel to finish, don't add 16 liters! Our auto fuel stops refueling exactly when you need, saving you tenths or seconds each stop.
  • Stop thinking in liters and learn to think in terms of pace. You don't need 21 liters of fuel with 0.5 laps margin, you need 6 laps with 3.45 L/lap push pace.
  • An auto fuel you can trust: after the race, you can go back and check the auto fuel prediction made during the race every 10 seconds. See how the race unfolded, pit stops, leader changes, and understand the auto fuel prediction. You'll learn to trust our auto fuel in no time, no need to overfuel just in case.
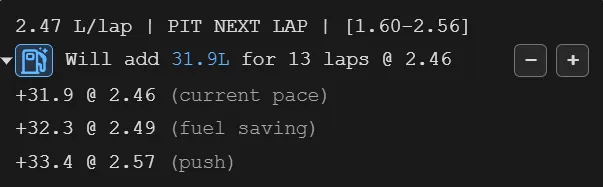
Automatically compute the fuel needed to finish at your current pace
Driver fuel overlay: will add 31.9 L for 13 laps at 2.46 L/lap
Check your fuel saving and push lap fuel usage
The Auto fuel line open: the fuel to add at the current pace, fuel saving and push
Set auto fuel to use the pace you actually want for your last stint (here 2.56 instead of 2.46 L/lap)
A custom pace of 2.56 L/lap: will add 33.3 L for 13 laps

Overlays

In development

  • Class standings.
  • Track conditions.
  • Multi class spotter.
  • Live telemetry - active reset practice.
  • Custom overlays.
  • More coming soon.
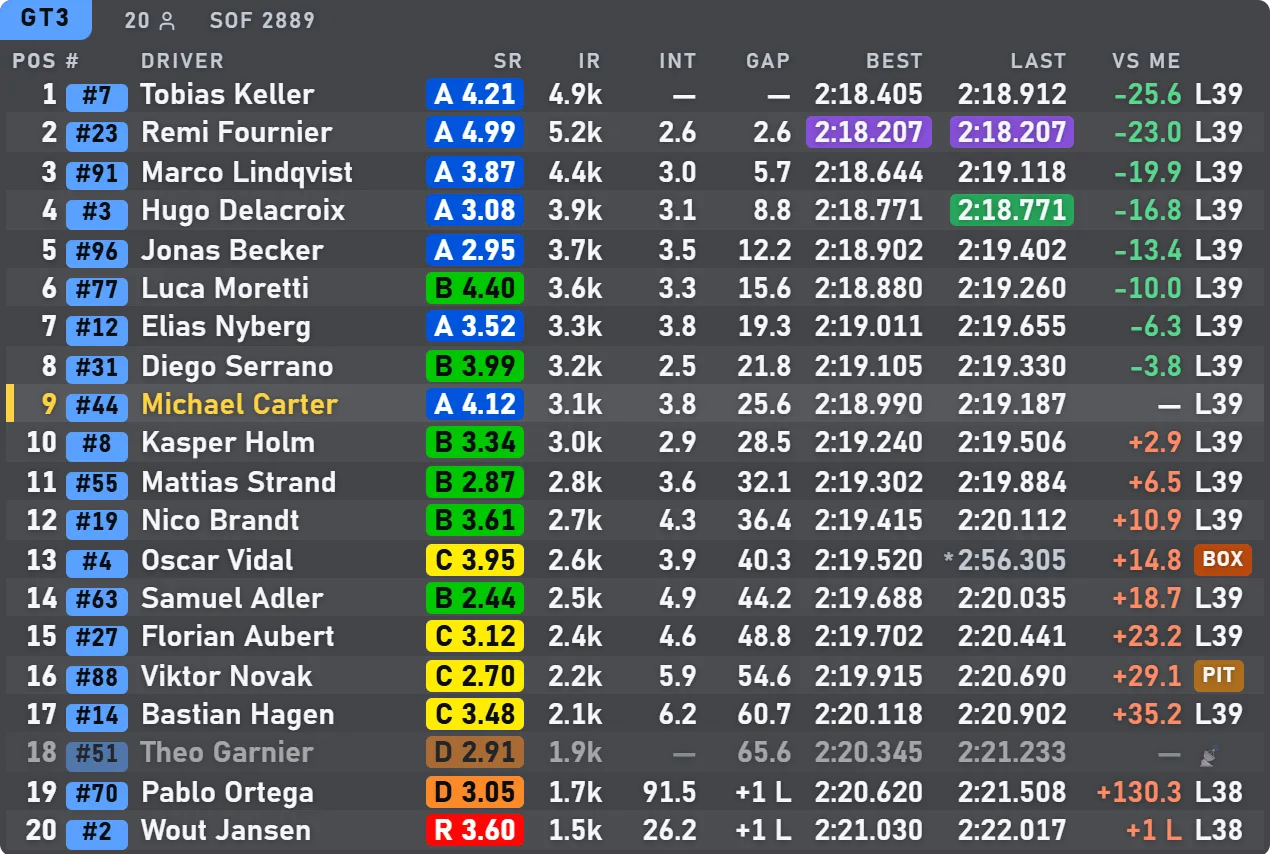
Class standings overlay in a 20-car GT3 race: position, car number, driver, safety rating, iRating, interval, gap, best and last lap, gap to you and status

Frequently asked questions

Does it work with other sims, like Le Mans Ultimate or Assetto Corsa?

Enduro Manager is built for iRacing. The race planner can be used to plan races for any sim, including LMU and Assetto Corsa.

Is it free?

Yes. Most features will stay free forever. Features that cost us money to run (ex: team radio) and some new advanced features may become paid.

Do I need to install anything?

The race planner works in your browser. Lap Compare and Telemetry Explorer also open your own iRacing telemetry files in your browser. Most other features need the desktop app for Windows.

Is it only for endurance races?

No. It can be used for all races. Our tools are developed with endurance races in mind, because they are the toughest and most complex races, so they also work for solo races or iRacing officials.

Do all my teammates need the desktop app?

Yes. Each driver must run the desktop app while driving. This is how we get the live data powering the live race plan.

Can I try it without an account?

Yes. Most tools open on an example race or example data, so you can try them without an account.

Try it on your next race

It's free!